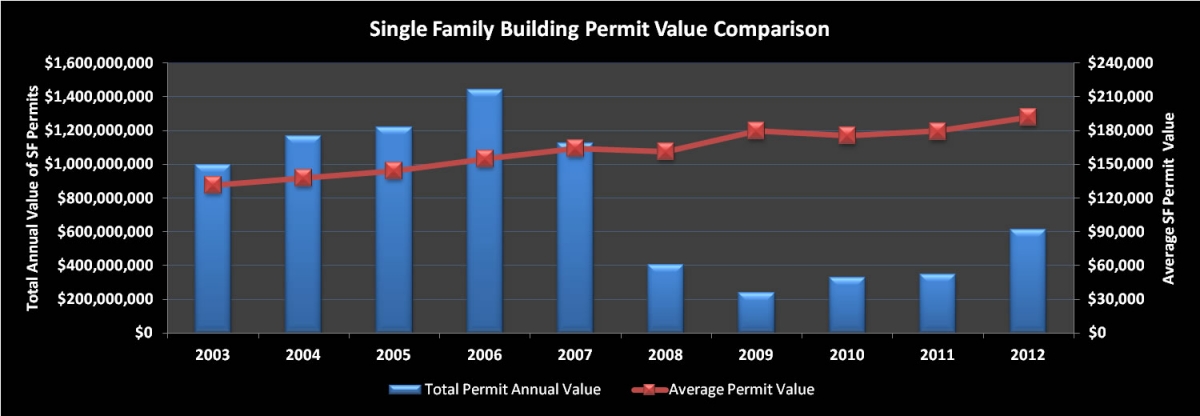
New single-family residential building permits in Mecklenburg County have been on a roller coaster ride since 2003. But preliminary numbers show a promising upswing heading into 2013. Using U.S. Census Bureau data1 to examine the previous decade's trends tracking back to 2003, what can we expect for new construction as we move forward in 2013?
In the heady years of 2003 to 2006, the number of permits issued for single-family residential buildings was consistently high, averaging close to 8,500 annually. That trend was broken in 2007 when total permits dropped to 6,857. The big tumble continued with the largest annual change, down to 2,496 by the end of 2008, a dizzying 63.6 percent drop.

It hit bottom in 2009, when just 1,315 permits were issued for the year. From a high of 9,287 in 2006 to the 2009 low, permitting plunged in a white-knuckle ride by an incredible 85.8 percent. In 2010 and 2011, the industry caught its breath and moved slowly forward, desperately trying not to lose its lunch. A slight uptick in 2011 posted only 80 more permits than the year before.
|
More information |
In more recent trends, things started off with promise in 2012, but a big drop from March to April seemed a bad omen. May showed a hardy rebound, when permits rose from April’s low of 132 to 293. A general upward trend continued until the year’s high of 344, in August. From August to November, 2012 was in decline, but December showed a slight upward turn.
Hang on, there is a silver lining. With a total 3,200 permits issued in 2012, the year posted an overall gain from 2011 of 1,251 permits, a substantial number and the largest year-over-year increase in the 2003-2012 period. January’s numbers aren’t in yet, but a quick look at single-family permit applications indicates a strong showing.

This is consistent with the number of plans being reviewed in Mecklenburg’s plan review department. “Our office has seen steady growth, reviewing about 120 to 150 projects a month,” said Patrick Granson, director of plan review and permitting for the county. “Most building activity is with large, locally based and national tract home builders,” Granson continued. “The plans we’re seeing are for middle to high-end single-family homes, plus a good number of townhomes or multifamily developments.” Granson attributes the county’s steady numbers to banks having relaxed their lending requirements. “Money is easier to get now,” he said.
In some places of the country, the value of single-family building permits also went down during the recession, indicating that builders or their clients were hesitant to build more expensive or larger homes. That didn’t happen in Mecklenburg County, where the average value2 of building permits issued has been on a steady increase since 2003. A barely perceptible dip occurred between 2007 and 2008, when the average value of a single-family building permit went from $164,184 in 2007 to $161,417 in 2008. Average permit values then resumed their upward pace, reaching $192,058 in 2012.
Multifamily construction in Mecklenburg County (in buildings with five or more units) has been on a different kind of roller-coaster ride, one filled with steep rises and dramatic falls. The total number of units permitted3 over the same 2003-2012 period has gone up and down, bottoming out in 2010. The three-year span between 2006 and 2008 is the only one free of volatility. The year 2003, at 2,112 units, marks the beginning of a bouncing ball path going up in 2004, down in 2005, then back up to reach a peak in 2007 of 4,430 units. A slight drop to 4,281 in 2008 was followed by a near free-fall to 2010’s low of 671 units. A modest gain in 2011 of 75 units set up the launching pad for 2012, where the number of units permitted skyrocketed to 4,660 – the highest yet. For additional reading about Mecklenburg's multifamily trends, see related articles here and here.

The positive, steady growth in single-family permits issued is a reassuring sign that the industry is taking steps toward recovery. The break-neck pace of the building-bubble years was obviously not sustainable, and this slower growth should give the market time to absorb the excess numbers of newly constructed homes and those permitted but not yet constructed. As for multifamily permits, where will it go from here? Venturing a guess based on recent trends would be just that – a guess.
Note1: U.S. Census data was used to compile all data in order to have a common working reference. The Census Bureau uses data reported monthly from public places issuing permits, including Mecklenburg County, the data source. More than one permit may be issued for a dwelling, so a one-to-one ratio of homes to permits is not implied.
Note2: The average cost of single-family building permits was computed by dividing the total annual value of permits by the total annual number of permits. More than one permit may be issued for a dwelling, so a one-to-one ratio of home values to permit values is not implied.
Note3: U.S. Census data includes the total number of units permitted for multifamily construction and the number of building permits. The number of units is used for a more accurate depiction of building trends as the number of units can vary greatly for each building permit.


