How are people in Charlotte Regional Data Trust data linked?

Think of a typical day in your life. You likely interact with multiple community resources: seeing your child off to school on the bus, clocking into your job, stopping at the pharmacy or grocery store, or attending a community or school event.
The Charlotte Regional Data Trust brings together information that typically exists across separate organizations, helping us better understand how people interact with multiple programs and services. Through data-sharing partnerships with local governments and nonprofits, the Data Trust provides a more complete picture of the complex, interconnected quality-of-life issues facing our region. These insights help us identify cross-sector needs, develop more informed solutions and understand how interventions affect people across organizations and systems.
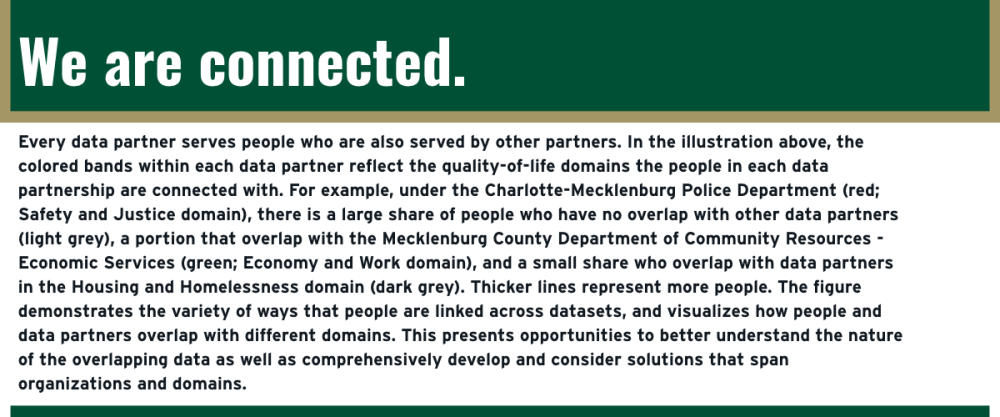
How are people represented in the Data Trust linked?
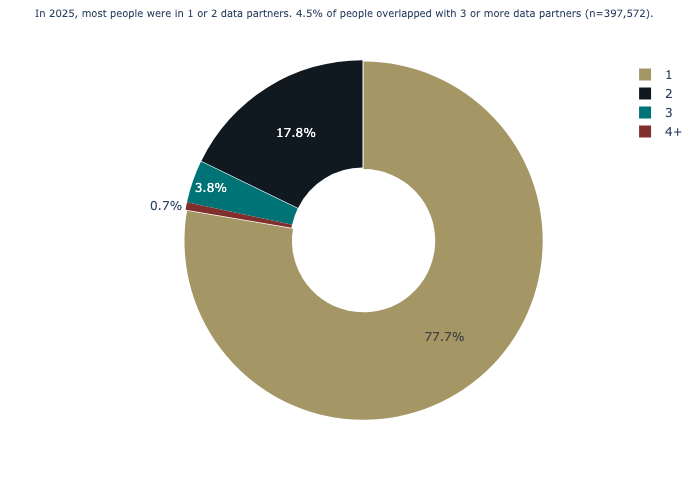
In 2025, there were 397,572 unique people represented in the Charlotte Regional Data Trust data, about 33% of Mecklenburg County’s population. If that number reflected the population of a city, it would be the THIRD LARGEST in North Carolina. Of those people, about one in five (22.3%; n=88,733) people were linked with two or more partners. Most people (77.7%; n=308,839) were reflected in at least one partner dataset (left chart, below).
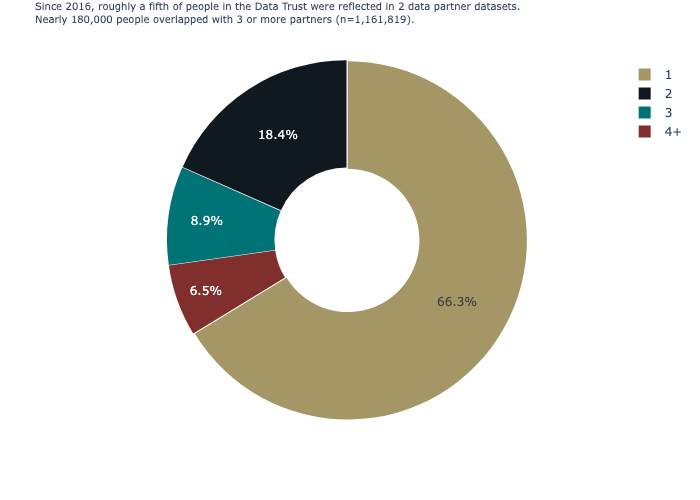
We also look at how people are linked over time. Cumulatively, since 2016, about one in three people (33.8%; n=391,761) were linked with two or more partners (right chart, below). Over time, we expect to see greater overlap between partners than we would see annually. This is because individuals may be reflected in multiple services as they age. For example, a child or adolescent receiving child welfare services may be reflected as an adult in Goodwill Industries of the Southern Piedmont or the Charlotte-Mecklenburg Homeless Management Information System. These longitudinal patterns are also important patterns for further inquiry. For example, it allows researchers to explore what factors in childhood predict whether an individual is more or less likely to become homeless as an adult. Administrative data along with Charlotte-Mecklenburg Quality of Life Explorer data can be used to examine these and related questions about quality of life.
Now, let’s take a closer look at specific data partners and how the people they serve are linked with other partners. By using the interactive tree map charts available in the 2026 State of Our Data Report, you can explore the percentage of people from one data partner (the source data partner) with all other data partners within the same year. The tree maps are in the section, “Overlap Across Datasets.” Watch the video below to learn more about how to use the tree maps and how people are linked.
people who were served by an HMIS agency were also enrolled in a benefit provided by Mecklenburg County Department of Community Resources – Economic Services (such as Food and Nutrition Services). Using the slider bar, we can compare this percent overlap across years and see that there are 2% fewer people who overlap with DCR – ES compared with 2024. In addition, there is a higher percentage of people who do not overlap with any partners, compared to 2024 (32.7% vs 29.6%). You can also see that 11.8% of people in HMIS were also students in Charlotte-Mecklenburg Schools. Additionally, about nine percent (8.6%) of people in HMIS were victims of a crime, about five percent (4.6%) were involved in the child welfare system, and two percent took a course or program at Goodwill Industries of the Southern Piedmont. These connections help us better understand the complexities of specific populations, such as those experiencing homelessness, which helps identify and target effective interventions and partnerships.
Used another way, we can look at connections across the housing continuum (in other words, how people are linked across the data partners in the homelessness and housing domain). When we look at INLIVIAN (which includes people receiving housing subsidies, who live in project-based housing, and on the waitlist for services), a small share of the people engaged with another agency providing housing support sometime in 2025: nine percent of people interacted with Crisis Assistance Ministry; almost six percent (5.7%) used a service through the Homeless Management Information System, and one percent were served by the Housing Collaborative. By exploring these connections, we can possibly uncover elements of successful long term housing and where gaps in support may still exist.
Why is it important to understand how people are linked across data partners?
Each connection tells a story and generates questions that can be explored. Such as, what factors are associated with individuals’ involvement with multiple organizations or with only one? Are there shared characteristics or experiences of people who interact with three or more partners? The absence of overlap can also be telling and can provide opportunity to explore and connect people to additional resources if needed.
Operationally, understanding these connections helps organizations understand if there are gaps in their services, if they are duplicating or effectively layering services with another provider, or if their programs are reaching their target audience who may be best represented in another partner’s data. From both an operations and research perspective, it is helpful to understand if involvement in one organization may impact outcomes in another. For example, if a student is in the child welfare system, how might that involvement impact school attendance or performance? Or if a person who is experiencing homelessness secures stable housing, are they less likely to be arrested or use the emergency room?
The way the Data Trust links data together allows us to see how the systems and services in our community are linked by the people they serve. Every data partner organization serves people who are also served by other partners. Further analysis to understand these connections allows us not only to see across systems, but better understand, coordinate and improve service delivery, as well as gaining a more comprehensive understanding of our experiences and outcomes, together and across time.
Read more about our partners and who is represented in the data here.
Interested in learning more about the Data Trust? Email us at datatrust@charlotte.edu.