Mapping minority health risks: A health surveillance dashboard for the Charlotte Region

by Evan Wright
I have always been interested in medicine and plan to pursue a career in the medical field. That interest grew through my participation in Science Olympiad, where I competed in the Disease Detectives event. Being tested on epidemiology and pathology gave me my first real look at how population-level patterns shape human health. However, as I looked at the broader medical landscape, a statistic made me pause: only about 5–6% of physicians in the United States are Black. That disparity made me question: what can I do right now, as a high schooler, to support and educate my community, rather than waiting until medical school to begin contributing?
I had always assumed that Charlotte’s rapid economic growth and large health industries meant residents were well-cared for. Upon closer inspection, however, I noticed that two individuals of the same age living just twenty minutes apart can face vastly different odds of developing diabetes or dying early. These outcomes often depend less on individual choices and more on structural factors like proximity to a physician, health insurance coverage, reliable transportation or household income.1
To address this gap, I created the Charlotte Region Health Risk Dashboard, an interactive public health data visualization tool built to analyze regional healthcare disparities and structural factors of health. It is part of a broader initiative I founded called the Minority Med Project, which pairs data visualization with an educational podcast to break down medical concepts and health equity topics. The dashboard focuses on 10 counties in the Charlotte Piedmont region, including Anson, Cabarrus, Cleveland, Gaston, Iredell, Lincoln, Mecklenburg, Rowan, Stanly and Union. Powered by a custom Python pipeline using pandas (good for large data sets), the system aggregates live data across multiple validated federal and state sources, including Centers for Disease Control PLACES for chronic disease prevalence, the North Carolina State Center for Health Statistics for mortality rates, U.S. Census Bureau American Community Survey for social determinants, the CDC Social Vulnerability Index, or SVI, and Health Resources and Services Administration data for primary care shortages.
All datasets are mapped via county FIPS codes, unique five-digit numbers used by the U.S. government to identify specific counties or county equivalents, into a structured dataset of 3,790 records. An integrated artificial intelligence, or AI, layer generates accessible summaries based on cleaned and validated computations without generating synthetic estimates. My advice to build similar tools is to start with a single trusted data source, and have the determination to expand on that. The true challenge lies in understanding the method you take to your final product.
The data revealed regional divides as expected. Here’s what stood out:
- Anson County emerged as the most under-resourced county analyzed: it is the only county in the 10-county region designated as a primary-care shortage area (about 6,771 residents per provider), with the highest uninsured rate (13.3%), highest poverty rate (21.7%), lowest median household income ($47,302) and highest overall SVI (0.95).
- Union County demonstrated the opposite baseline: a median income of $102,900, a 7.7% uninsured rate and an SVI of 0.20.
- Mecklenburg County recorded the highest diversity metrics and the region’s highest SVI score for racial/ethnic minority status and language (0.89).
For several health conditions, Black residents had higher age-adjusted mortality rates than White non-Hispanic residents, highlighting racial disparities in health outcomes. Medical anthropologist Clarence Gravlee2 notes that “race becomes biology.” This means that observed health gaps across racial groups reflect how social inequality manifests physically in bodies over time. When Anson County exhibits high disease rates alongside severe resource deficits, those outcomes represent under-resourcing rather than biological differences.
Looking forward, I plan to continue the Minority Med Project by expanding the platform’s data coverage and presenting it to bigger universities and organizations. I also plan to continue my academic journey in the pre-medical and public health fields.
The future of inclusive healthcare relies on moving from abstract national averages to local insights.
My goal is for this open-source dashboard to be utilized by local health organizations, policymakers and other researchers to create bigger interventions. While data alone cannot eliminate health disparities, making these spatial patterns visible and verifiable is a good step toward making information easily accessible and understandable for the community!
References
1 National Academies of Sciences, Engineering, and Medicine, “Social Determinants of Health and Health Equity,” in The Future of Nursing 2020-2030: Charting a Path to Achieve Health Equity, eds. Mary K. Wakefield, David R. Williams, Suzanne Le Menestrel, and Jennifer Lalitha Flaubert (Washington, DC: National Academies Press, 2021), https://www.ncbi.nlm.nih.gov/books/NBK573923/.
2 Clarence C. Gravlee, “How Race Becomes Biology: Embodiment of Social Inequality,” American Journal of Physical Anthropology 139, no. 1 (2009): 47–57, https://doi.org/10.1002/ajpa.20983.
About the author
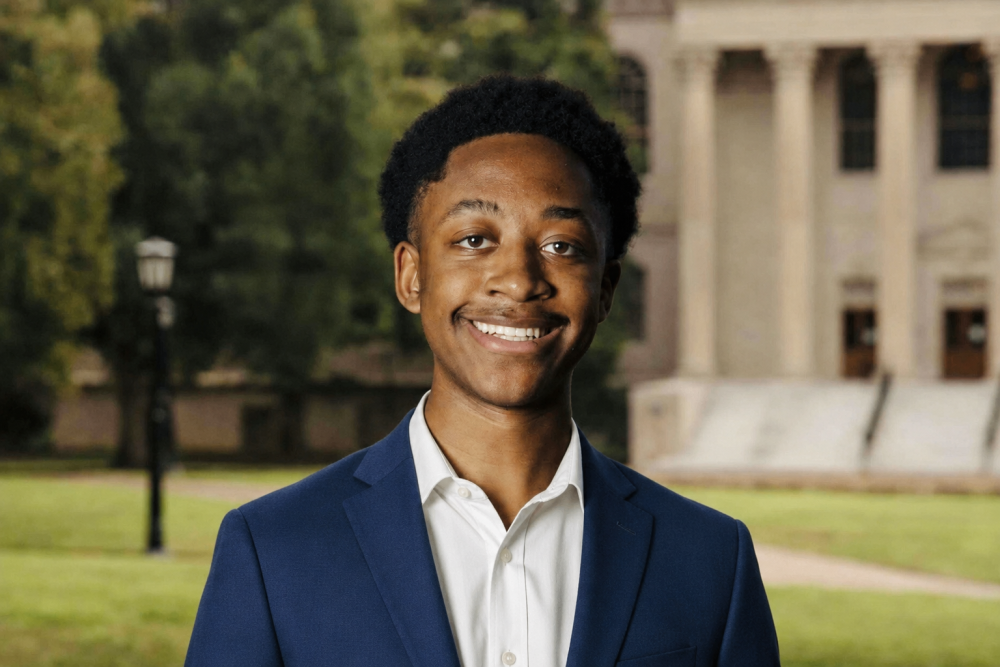
Evan, a participant in the City of Hobbies Youth Fellowship, is a rising senior at Ardrey Kell High School in Charlotte with aspirations to pursue a career in medicine or public health. He developed the Charlotte Region Health Risk Dashboard as part of the Minority Med Project, an initiative designed to make health equity and medical concepts accessible to local communities. His academic interests include biology, chemistry, pathology and cardiology. Outside of academics, Evan likes to play basketball and edit videos
About the City of Hobbies Youth Fellowship
The City of Hobbies Youth Fellowship is a compensated, youth-led initiative funded by The Gambrell Foundation The fellowship engaged 25 high-school-aged young people across Charlotte-Mecklenburg to explore how hobbies foster purpose, belonging and joy. Fellows conducted approximately 100 interviews and 100 observations of spaces across Charlotte, examining how young people discover and participate in hobbies and the barriers they face. Their work is helping inform recommendations and four pilot hobby placemaking ideas to be tested across Charlotte this fall and winter. The Charlotte Urban Institute supported the fellowship’s qualitative research, helping fellows develop interview questions that elevate youth perspectives and uncover gaps in access, opportunity and support.