Mapping proficiency for students with limited English, and migrant students
The UNC Charlotte Urban Institute is providing weekly maps and data dashboards to highlight relevant statewide education statistics for EducationNC, a nonpartisan, nonprofit news source aiming to create a bipartisan, statewide conversation about public schools. Learn more about this new initiative here.
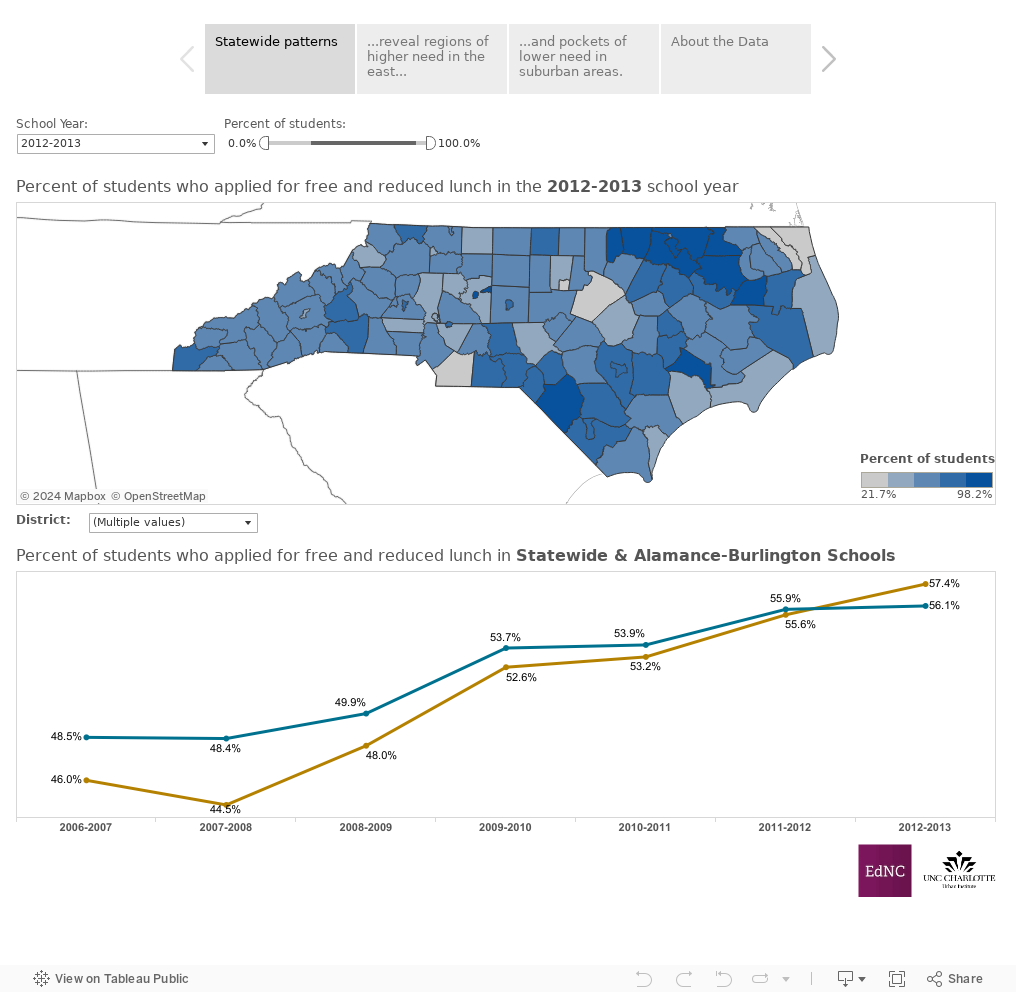
This week’s EdMap allows you to explore rates of proficiency among students with limited English proficiency, as well as migrant students (LEP/MIG).
The maps this week look at lesser-known subgroups of students. These include students with limited English proficiency (LEP) students and migrant students. As illustrated in the top statewide map, students identified as LEP were less proficient in all relevant subjects, compared to all students in the bottom map. While this is not surprising, limited proficiency in English can cause students to struggle in subject areas, including math and science, and is not limited to reading or English courses.
This week’s maps also look at migrant students’ proficiency. Although migrant students account for a small percentage of students throughout the state, they are concentrated in some areas including Buncombe and Henderson counties in the west and Rockingham County near the Virginia border. Migrant students are most often found in the eastern portion of the state near Interstate 95 and southeast towards the coast. Similar to LEP students, migrant students were less proficient in each of the relevant subjects, as the maps illustrate.
To dive deeper into the data, click on the second tab above the maps to view district- and school-level data on LEP and migrant students. The data in the map is also presented in a chart so you can easily compare how these students performed at the individual school level, compared to all students at that school. Clicking on a school location on any map or the school name on the chart will highlight that school in each of the ways the data is displayed. Note, if no data appears in the map or chart for migrant students, this is because there are no migrant students enrolled in this school. Similarly, if no data appears for a certain grade or subject selection, data are not available for that selection.
Additional information is available on the N.C. Department of Public Instruction website about programs and guidelines for migrant and LEP students.