Student Absenteeism Persists in Mecklenburg County

By Katie Zager
New data published to the Charlotte-Mecklenburg Quality of Life Explorer shows that the rates of chronic absenteeism, when a student misses 10% or more of days in a school year – excused or not, among students in Charlotte Mecklenburg Schools (CMS) remain elevated. Countywide, 22% of students met the definition of chronically absent during the 2022-2023 school year. While absenteeism rates the past few years are shaped by the post-pandemic educational landscape, the places where rates are highest reflect long-standing disparities and barriers to school attendance.
School attendance is critical to student success. According to the National Center for Education Statistics, absenteeism reduces the effectiveness of teachers, and is associated with negative outcomes – even in early grades. By high school, attendance significantly correlates with graduation, and chronic absenteeism can result in a “pile-on” effect of loss of course credits, disciplinary action, and missed opportunities and engagement at school.
Absenteeism rates are elevated since the pandemic
Nationwide, student absenteeism rates have nearly doubled since the COVID-19 pandemic changed where and how children attend school. Three school years later, rates remain elevated. Countywide, rates of absenteeism increased from 21% in the 2020-2021 school year, to 26% in 2021- 2022. The rates decreased slightly for 2022-2023. However, even pre-pandemic, CMS saw increasing rates of absenteeism over the years, including an increase from 8% in the 2012-2013 school year, to 13.5% in 2018-2019.

Rates increased, but patterns stayed the same
As noted above, the absolute percentage of students who are chronically absent has increased post-pandemic, in almost all neighborhoods.
The image below shows how many students miss school in neighborhoods across Mecklenburg County. Darker colors indicate higher rates of absenteeism. The years refer to the year in which that school year ended (i.e. 2013 is the 2012-2013 school year).
| 2013 | 2019 | 2023 |
 |  |  |
However, the overall pattern of which neighborhoods have elevated rates of absenteeism, relative to the county, have largely stayed the same. Despite the pandemic bringing rates in some neighborhoods to remarkably high levels, neighborhood-specific differences in absenteeism have been a long-standing challenge.
The following maps use a statistical clustering algorithm to show which neighborhoods have high or low rates of absenteeism relative to their neighbors. The areas in light red are neighborhoods with high rates of absenteeism that are located next to other neighborhoods with comparable rates. Light blue areas indicate neighborhoods with low rates. The bright red and bright blue show outliers – neighborhoods with high or low rates respectively, near neighborhoods that are not like them.
Map 1: Chronic Absenteeism in 2013

Map 2: Chronic Absenteeism in 2023


In both maps, the light blue areas (low-low clusters) are located south of Uptown, and in the northern part of the county, while the light red areas (high-high clusters) are located to the west, north and east of Uptown, in a “crescent” pattern.
Neighborhood-level differences indicate underlying factors
There are many factors that impact school attendance. Attendance Works, a national nonprofit aimed at increasing school attendance, released a call-to-action last fall detailing school and district-wide disparities, especially as they relate to race and poverty.
Attendance Works cites several reasons students might miss school, all related to individual occurrences at school, or in the neighborhood. Find those reasons in the chart below or here.

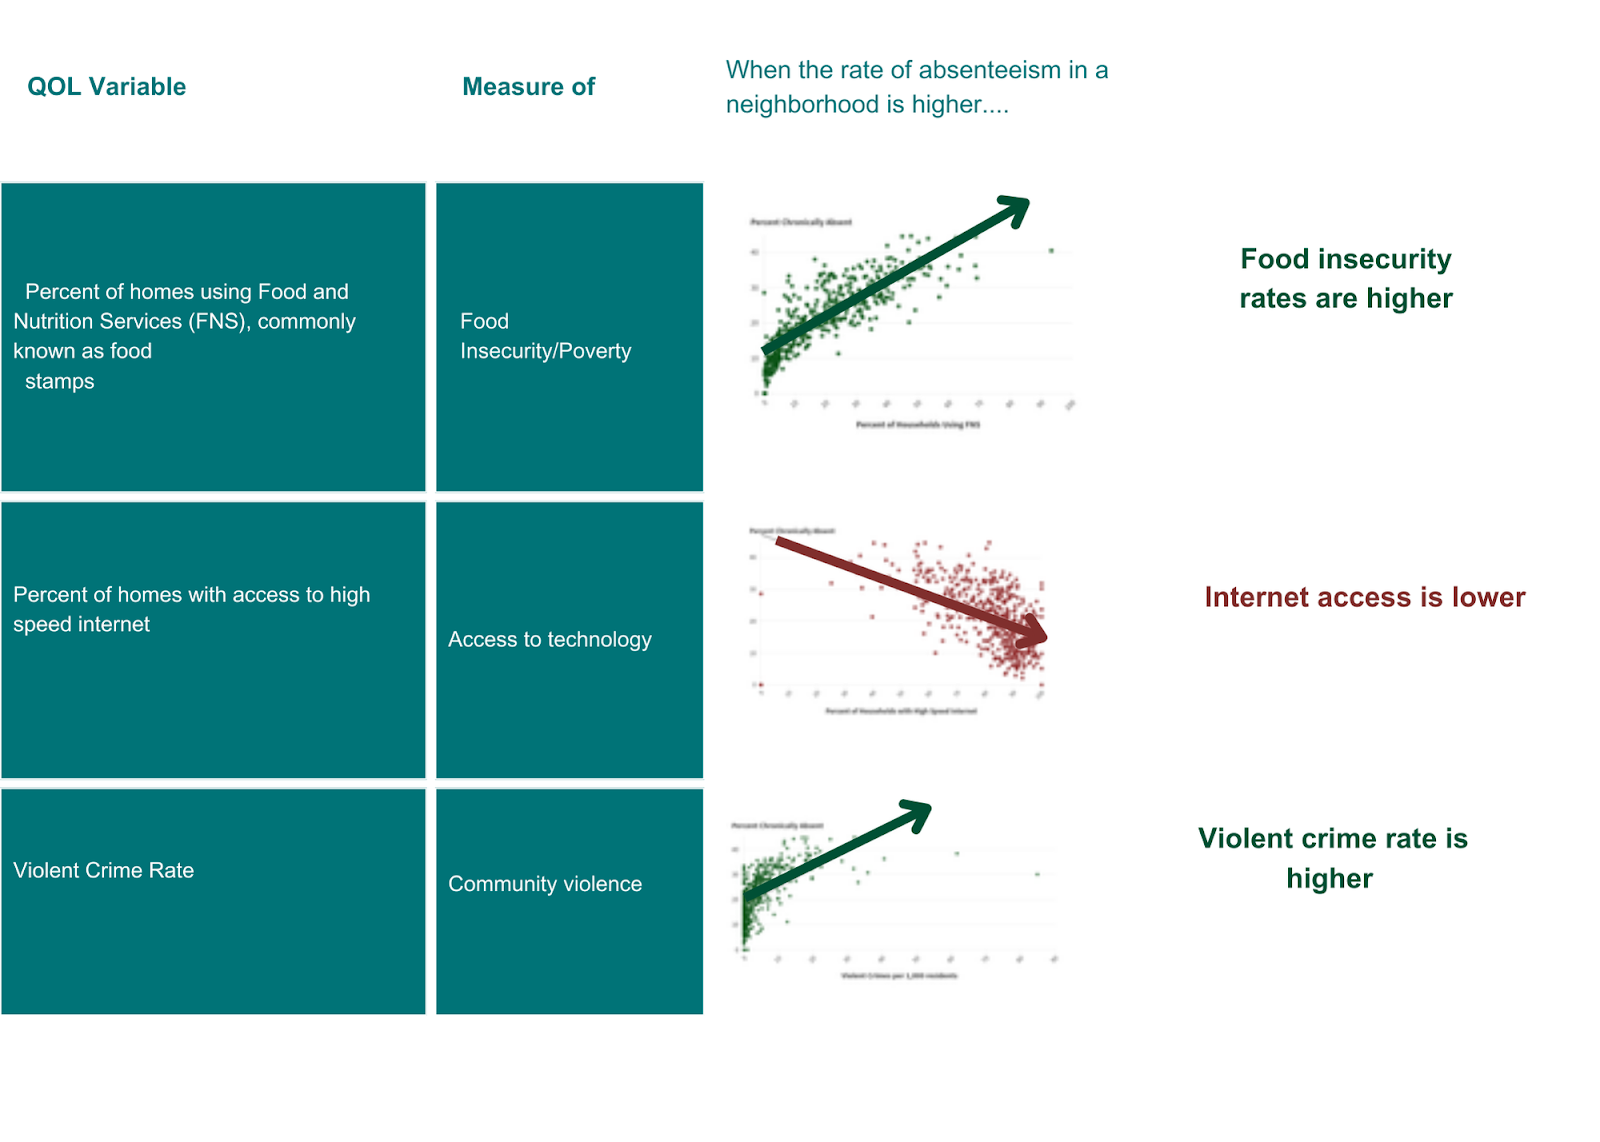
Neighborhood level data in the Quality of Life Explorer can speak to several of the barriers that students might face. The following chart shows different QOL variables and explains what they measure, and how they correlate to absenteeism in 2023. The closer the correlation is to zero, the less of a relationship it has to absenteeism. There is a large positive correlation (.83) between absenteeism and food insecurity, meaning the more absenteeism there is, the more food insecurity there is.
The data shows there is no relationship to access to needed services, such as healthcare clinics (.07) and pharmacies (.03). Surprisingly, proximity to school-age care correlates positively (.45) with absenteeism. Neighborhoods with better access to childcare also have higher rates of absenteeism. However, correlation does not equal causation. Another underlying factor, such as population density, might be at play here. It can also be that proximity might not adequately represent access – a higher number of households near a childcare center could mean increased competition for a limited number of openings, and therefore less access overall.
There is a positive correlation (.58) between absenteeism and violent crime, and a negative correlation (-.49) with technology – the more households that have access to high-speed internet, the lower the absenteeism rate.
Correlation Table
Taken together and modeled at the neighborhood level, the percentage of households using FNS is by far the biggest factor in predicting rates of absenteeism. When accounting for FNS, the proximity variables and access to high-speed internet were not significant. However, violent crime was a significant predictor of student absence, so as a result, we’d expect neighborhoods with higher rates of FNS use and crime to have higher rates of absenteeism.
It is important to note, however, that the model indicates more information is needed, likely variables related to the school itself, and the individual child, to make a more accurate determination. A more robust model would include data relating to aversion (dislike of school), engagement and misconceptions, as noted above. Potential measures would be those related to disciplinary action, such as suspensions, academic struggles, such as grades, or misconceptions, such as the students grade level.
However, this exercise tells us two important things. First, our results, like those of Attendance Works, show that poverty is a major determinant of absenteeism. The second is that there are many barriers to attendance that are outside of the school’s control. It is up to policy makers in all areas to consider how changes in the circumstances of a community or its residents contribute to absenteeism.
Attendance is improving
Attendance Works offers several strategies for improving school attendance including increasing feelings of connectedness, family engagement, and coordinating community resources.
CMS has spent the past year doing many of these things – creating incentives and increasing student engagement through the attendance+ initiative, providing schools with coordination, resources and strategies to improve attendance, and celebrating Attendance Awareness Month. Attendance Awareness month is observed nationally every September. CMS schools had activities like pajama day or ice cream socials to pair with their attendance message, while the district highlighted all it is doing to reduce absenteeism. The school district also started enforcing its attendance policy, where they refer chronically absent students to social services, and, in the most enduring cases, schools will file a complaint in court.
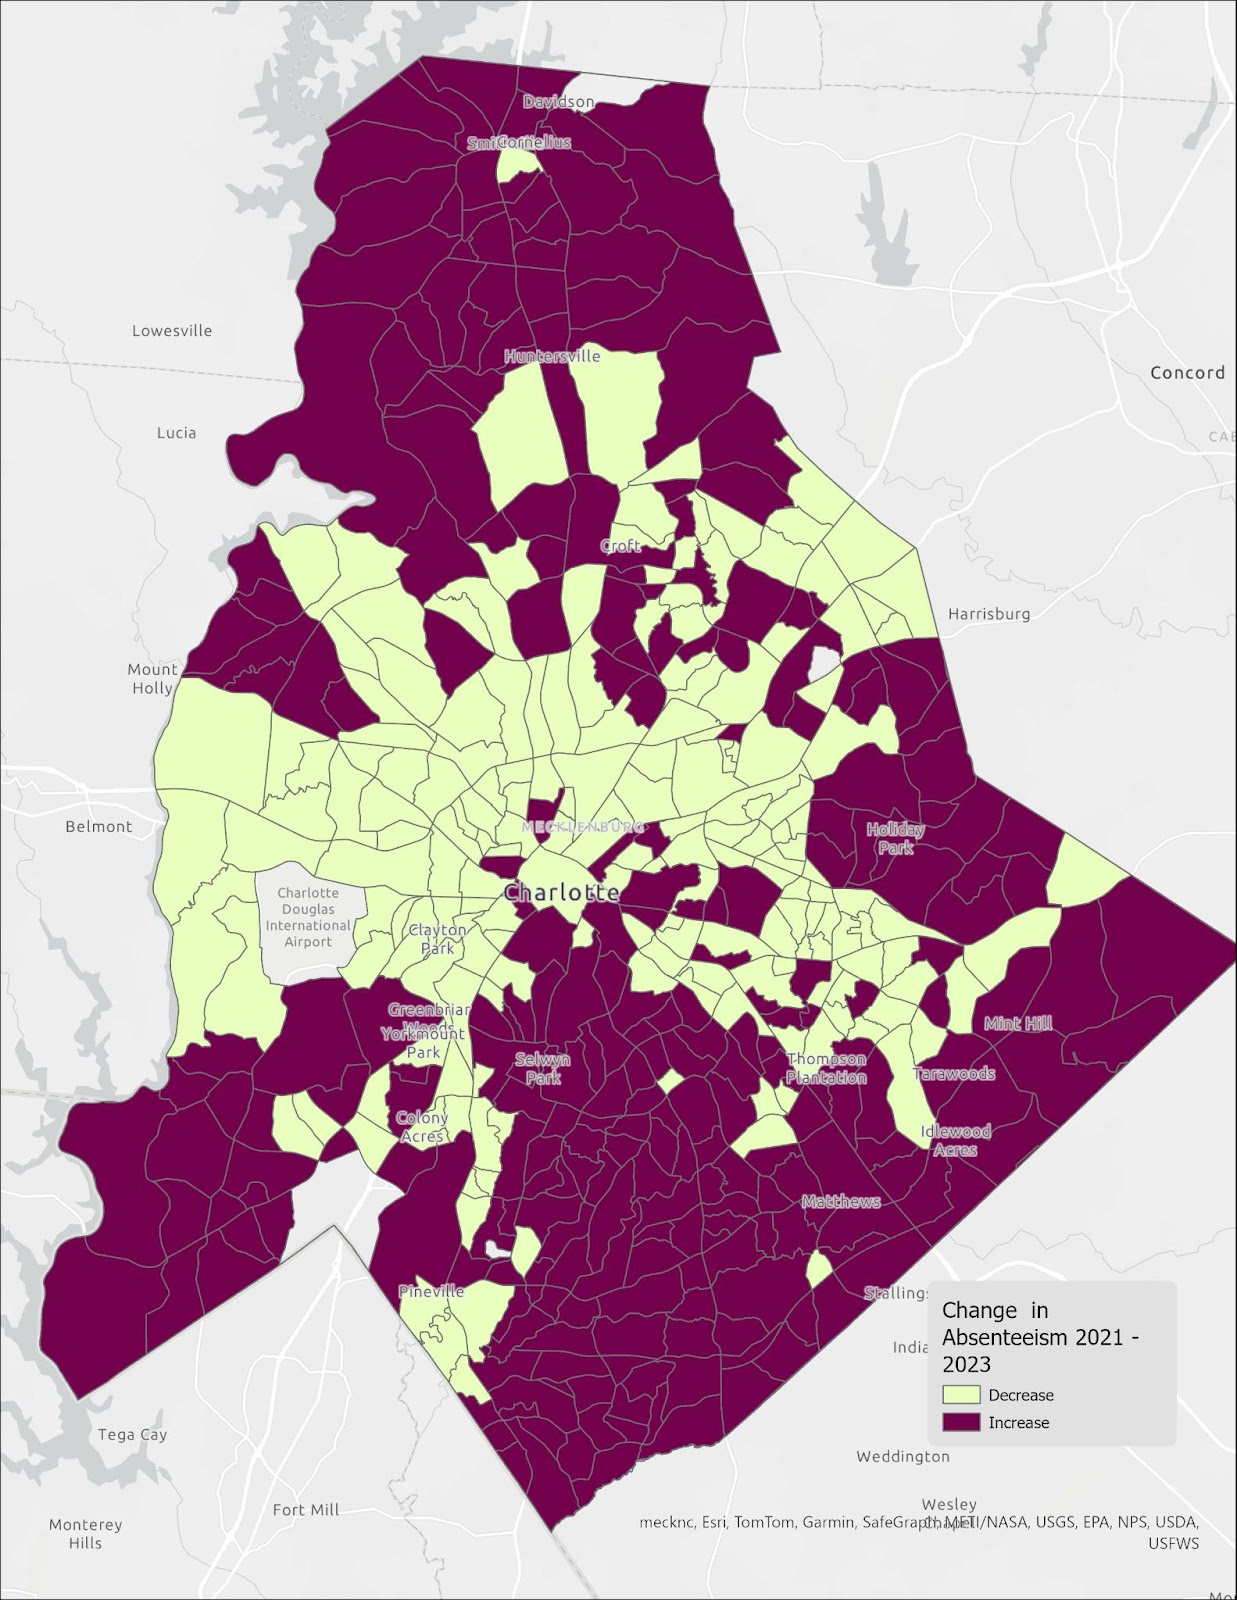
The results are apparent in QOL data: neighborhoods that have some of the highest rates of absenteeism are among those that saw a decrease between 2021 and 2023.
Map 3: Change in Rate of Chronic Absenteeism, 2021 – 2023
It is somewhat surprising that even three years after the pandemic began, student attendance is still a challenge.
We have learned however, that structural barriers accounting for different rates of absenteeism have always existed, but that with concerted effort, schools and districts can in fact move the needle on this issue.