Which Mecklenburg County neighborhoods have grown the most?

One of the questions we get most at the UNC Charlotte Urban Institute often relates to population growth–which places are growing fastest, and why? These inquiries often relate to county or city/town population estimates, which the U.S. Census Bureau releases on an annual basis. But we decided to dive a little deeper, and take a look at neighborhoods in Mecklenburg County, using the Charlotte-Mecklenburg Quality of Life Explorer.
Map: Neighborhood Level Population Change as a Percent of Population, 2010 – 2020
This map shows the percent population change from 2010 to 2020 by neighborhood (what the Explorer calls Neighborhood Profile Areas, or NPAs). At this level of geography, decennial census data, that is, the complete counts the Census Bureau gathers every 10 years, are the most accurate measure of population available. This map covers the change experienced between 2010 and 2020.
The fastest growing neighborhoods include areas along the Blue Line Extension, around UNC Charlotte, in North Charlotte, and in the Steele Creek Areas.
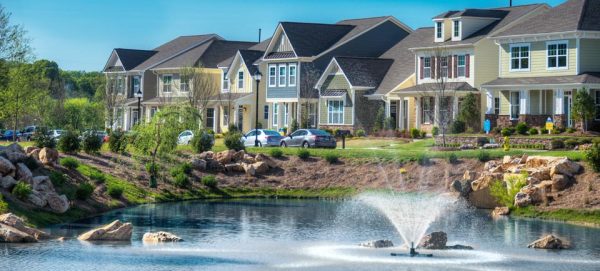
The neighborhood with the largest population increase is the Brightwalk Neighborhood (NPA 126), whose population increased a whopping 10,238%, from 13 people in 2010 to 1,344 in 2020. This is because, in 2010, the community was in the midst of a massive redevelopment. The aging Double Oaks affordable housing community was demolished and replaced with the Brightwalk Development, a mixed-income community which completed in 2013.
This growth also shows that neighborhoods that have very low base populations, i.e. started with a lot of vacant or undeveloped land, can see growth in the double, triple, or even quadruple digits, whereas other neighborhoods have experienced more steady growth over time.
Areas along the Blue Line saw population growth in the triple digits. One such neighborhood, Optimist Park (NPA 22), saw its population go from 736 people to 2,480, an increase of 237%. Prior to the Blue Line development, this neighborhood was a mix of older single-family homes, and industrial uses that were located near the existing freight train tracks and yard. As the Blue Line was built parallel to the existing tracks through this neighborhood, those industrial parcels were replaced with hundreds of apartments; 415 new units were built in 2017 alone.
Neighborhoods along North Tryon Street, near UNC Charlotte (NPA’s 219 and 231), saw similar growth as new apartments were built near the Blue Line and to accommodate growing numbers of UNC Charlotte students. These apartments were built on large tracts of undeveloped land or under-utilized commercial properties, known as infill development.
Hot neighborhoods are still close to Uptown
Neighborhoods in South End (NPA 339) and along Morehead Street (NPA 361), christened FreeMoreWest by developers, saw growth of 220% and 107% respectively. Surrounding neighborhoods, such as Dilworth and Seversville, which have much more established neighborhoods and populations, still saw growth upwards of 50%.
The Commonwealth Neighborhood (NPA 315), along Central Boulevard near Plaza Midwood also saw tremendous growth of 223%.
The suburbs are growing, too
Other NPAs, such as 256, 45 and 203, found in the Southeast corner of the county, all saw growth over 120%, largely due to new construction of housing. This is due to a lot of new development on vacant or formerly agricultural tracts of land. Although these areas are growing, they remain less densely populated than many areas of Charlotte, especially the neighborhoods closer to uptown. Neighborhoods in North Mecklenburg, such as NPA 438 in Huntersville/Cornelius, are also seeing this type of growth. The population increased by 492% between 2010 and 2020.
Some neighborhoods saw little or no population growth
Some neighborhoods, particularly in East Charlotte, saw little or no population growth. These are areas with older housing stock, and more established single-family neighborhoods. They are also fairly dense, and most commonly, have little or no new housing development. The stable housing stock, combined with a decreasing average household size in the county, leads to stable or declining populations in these neighborhoods as well. These dynamics could be laying the groundwork for future development, but for now, serve as a base of older and more affordable housing stock for longer term residents.
The way these neighborhoods end up being developed; the mix of housing types, residential density, and, ultimately, population growth, have a tremendous impact on the quality of life for residents in and around these neighborhoods.
Generally, population growth leads to more commercial development and amenities coming to a neighborhood. Planners generally see density as a good thing, as it allows for more efficient delivery of city services, and population centers attract more jobs and commercial opportunities. However, too much density, especially when it is 100% residential, can make an area feel homogenous–just more of the same. Lack of transit access or adequate infrastructure can also lead to increased traffic congestion.
However, as with any growing city, and especially one as dynamic as Charlotte and its surrounding areas, development, and the population changes that come with it, are never truly done.
Want to explore more?
You can use the NPA numbers cited in this article to explore the relationship between Residential New Construction , Residential Demolition , Housing Density and Population Density.
You can even see how things have changed in these neighborhoods since 2020.