Jobs in Charlotte? Numbers change, district to district

When we think about jobs coming to Charlotte, we may think of the flurry of press releases, photo ops, and political backslapping that all accompany a big announcement. Yet despite the role the city plays in promoting job growth, jobs are not spread evenly across the city’s seven Charlotte City Council districts. Since jobs are a good indicator of economic health, we decided to see whether those seven districts are equal in jobs per capita, and in job growth.
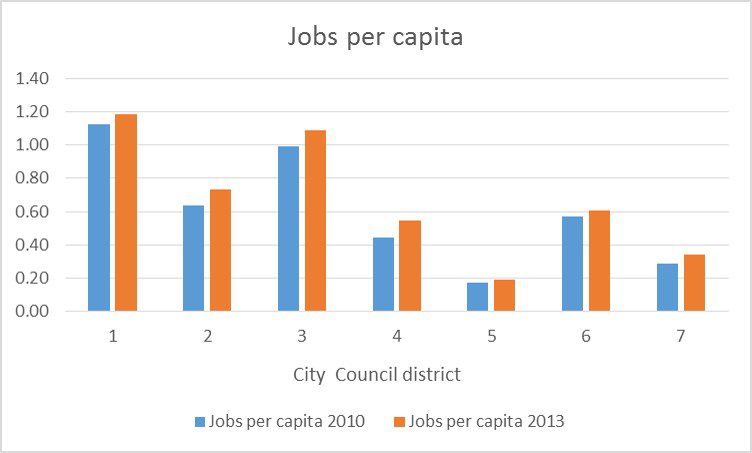
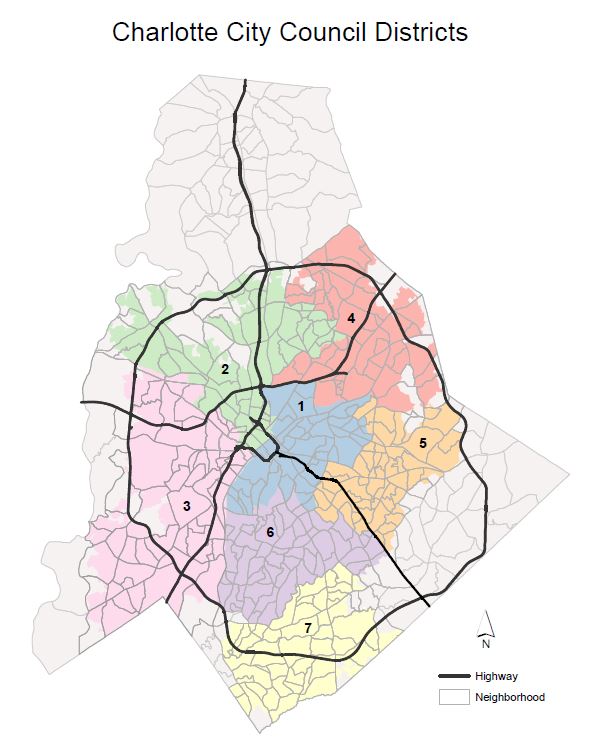
Although districts are roughly the same in terms of area and population, Districts 5 (east Charlotte) and 7 (south Charlotte, including Ballantyne) have the fewest jobs per person. Districts 1 (part of uptown and close-in neighborhoods) and 3 (west and southwest Charlotte, including the airport) show the most.
|
Using the Quality of Life Explorer This article contains data from the Quality of Life Explorer, an online tool for exploring the social, housing, economic, environmental and safety conditions in Charlotte and Mecklenburg County. The Explorer was used to get data on the population and number of jobs in each Charlotte City Council district. With this tool you can view data by jurisdiction (cities and towns), by county commissioner and City Council district with the click of button. Look for it below the map. |
A bit of background: For City Council representation Charlotte has seven council districts, with representatives elected by residents of each district. The 11-member council also has four members elected at large. The council’s decisions can affect community safety, economic development, housing, neighborhood development, planning and transportation. The council districts range in population from 116,000 to 138,000 people. They districts also cover large geographic areas, and as a result are a mix of residential, commercial, industrial and institutional development such as uptown skyscrapers, hospitals and schools, or a neighborhood shopping center.
Besides being an indicator of economic health and the performance of an area of town, they are particularly interesting in light of the economic recession and the years since. Despite its growing population, Charlotte felt the impacts of the recession and a lengthy economic slump. By 2010 Charlotte had 7 percent fewer jobs than in 2008. Nor did the recession affect all council districts equally. District 2, which includes Third and Fourth wards uptown and much of northwest Charlotte, lost 15 percent of its jobs between 2008 and 2010, while districts 6 and 7 in south Charlotte each lost less than 2 percent.

Chart: Katie Zager
We looked at job growth in Charlotte from 2010 to 2013, as the country was emerging from the economic downturn. Looking at jobs per capita also takes population growth into account. Overall, Charlotte has .68 jobs per capita, and approximately .97 jobs per person between ages 18 and 64. The city experienced both strong job growth and population growth, averaging an 8 percent increase in population and 20 percent increase in the number of jobs from 2010 to 2013.
However, people do not necessarily live and work in the same part of Charlotte, or even in the same city. About 30 percent of the jobs in Mecklenburg County are held by workers who commute from another county. (See Quality of Life Explorer map of neighborhoods with more residents with long commute times.) Charlotte’s population is also fairly young and mobile. According to the 2014 American Community Survey, the proportion of the population between the ages of 20 and 39 is about 25 percent higher than the statewide rate for North Carolina. Among Charlotte residents, 22.6 percent have moved in the previous year, compared to 15 percent for North Carolina as a whole.
Click image for larger view of map
HOW IS YOUR DISTRICT DOING?
DISTRICT 1
District 1 includes First and Seconds wards uptown, as well as the neighborhoods of NoDa, Plaza Midwood, Sugar Creek, Druid Hills and Dilworth. Dilworth is home to the Carolinas Medical Center Main Hospital, and Second Ward is home to Wells Fargo, the city’s two biggest employers.
District 1 has the highest number of jobs, 147,589, as well as the most jobs per capita: 1.18 jobs per person. District 1 has seen a tremendous influx in real estate investment since 2013, and with the Lynx Blue Line forming the backbone of this area and dozens of high-density housing projects announced or under construction, this area is poised for tremendous change.

Chart: Katie Zager
DISTRICT 2
District 2 includes Third and Fourth wards uptown and much of northwest Charlotte, including Northlake Mall and parts of University Research Park, a major employment center. Districts 1 and 2 have about the same amount of commercial space (72.6 million square feet and 73.3 million square feet respectively), and the same rate of population growth (8 percent), yet District 2 has seen a much greater increase in jobs, from .63 in 2010 to .73 jobs per person in 2013, with a 25 percent increase in the overall number of jobs.
DISTRICT 3
District 3 includes much of west and southwest Charlotte, including the Steele Creek area and, most importantly, Charlotte Douglas International Airport. This district has by far the most commercial space, with 109.3 million square feet. It also saw the largest change in population, an 11 percent increase. Between 2010 and 2013 there was a corresponding 21 percent increase in jobs. It is one of two districts with more than one job per capita, at 1.09.
DISTRICT 4
District 4 covers much of northeast Charlotte, including UNC Charlotte and University Research Park. This area has seen the greatest increase in the number of jobs between 2010 and 2013, increasing by 33 percent from 53,000 jobs to 70,000. UNC Charlotte, a major institution, will see continued growth and is expected to be a community of 40,000 students, faculty and staff by 2020.

Chart: Katie Zager
DISTRICT 5
District 5 includes much of southeast Charlotte, including the southern portion of U.S. 74/Independence Boulevard, as well as the old Eastland Mall site. This part of town has by far the fewest jobs per capita, with .19 jobs per person. With 22,156 total jobs, District 5 also has the least amount of commercial space, with 12.3 million square feet. It is likely people living in this part of town commute to other areas for work, as unemployment is only slightly higher than the county average.
DISTRICT 6
District 6 includes several established neighborhoods south of uptown Charlotte, such as Myers Park and Cotswold. The district also includes SouthPark mall and the surrounding area as well as some commercial development along U.S. 74. Overall, the district has .6 jobs per capita and the lowest job growth, increasing 12 percent from three years prior. The low job growth is likely due to this area’s relative stability through the recession. Circa 2008, uptown was home to almost exclusively “Class A” office space, leased by banks and related industries, whereas SouthPark has a wider variety of commercial development.
DISTRICT 7
District 7 is in south Charlotte, including Ballantyne, southern Providence Road and areas adjacent to Matthews. It saw modest population growth (7 percent), and the second highest rate of job growth. While primarily residential, District 7 is also home to developments like the Ballantyne Corporate Park. In fact, commercial space increased by 2.6 million square feet between 2011 and 2013, more than Districts 1 and 2 growth combined. This shows that suburban commercial development is still a force to be reckoned with in Charlotte.
CONCLUSION
The numbers show us that districts 1 and 3, close to uptown, are the only areas with more jobs than people. District 2 seems poised to join their ranks, but the simultaneous growth of jobs and population might make it a district where people truly live and work. It’s might be surprising, since between 2013 and 2016 so much media attention has been devoted to growth in and around the uptown core of Charlotte. Yet in the immediate post-recession period, job growth was fairly evenly spread throughout the city, with suburban districts 4 and 7 seeing the most growth.
There are no areas of Charlotte where population growth outpaced job growth. Interestingly, towns and counties around Charlotte also saw more job than population growth. However, Mecklenburg County has significantly more jobs per capita. For example, fast-growing Union County only had .26 jobs per capita in 2013, compared to .55 for Mecklenburg County.
