Charlotte neighborhoods and the Great Recession

How do you define what makes people think of one neighborhood as “good” and another “bad”? Is it things such as crime, school quality and amenities? What about walkability, accessibility of employment or environmental quality? Whether you consider one or all of these characteristics, they are all important and affect the quality of life for a neighborhood’s residents. Those characteristics also tend to change over time, and according to a recent study by researchers at UNC Charlotte’s Renaissance Computing Institute (RENCI), some Charlotte neighborhoods have done just that: increased or decreased their overall quality-of-life score from 2000 to 2010. Some conclusions from this study lead researchers to believe the economic recession may have played a large part in some of those changes in quality of life, and not surprisingly the impacts of the recession appear to be felt more strongly in neighborhoods with lower quality-of-life scores.
|
What is RENCI? RENCI at UNC Charlotte is part of the RENCI statewide network, a shared venture among several N.C. universities, in which researchers use advanced computer technology to address public policy issues. To learn more about RENCI at UNC Charlotte, click here. To read a more technical version of this article, at the RENCI website, click here. |
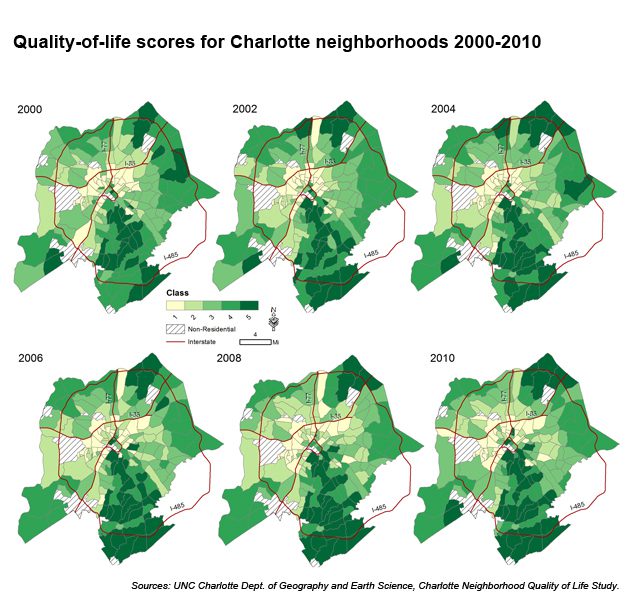
To measure levels of and changes in quality-of-life scores for Charlotte’s neighborhoods, researchers first classified each neighborhood into one of five classes according to their quality-of-life score for the entire decade. Classes one and two are below the average for the entire city, class three is around the average, and classes four and five are above the average. According to the study, neighborhoods with the highest quality-of-life scores are found in the southeastern corridor of the city. Neighborhoods with the lowest quality-of-life scores are concentrated in the first “ring” around uptown Charlotte. Over time, higher value neighborhoods began to concentrate northwest of the university area, while more neighborhoods began to join the first ring around uptown in concentrations of low quality-of-life neighborhoods.
Overall, the study showed that during the 2000-2010 decade, neighborhoods generally tended to improve their quality-of-life scores, especially those that began with low scores. It also discovered a shrinking disparity between the best and worst neighborhoods from 2000 to 2010, suggesting the urban quality-of-life landscape became more equitable during the period.
If Charlotte neighborhoods have, in fact, seen improved quality of life over the decade, which neighborhoods were more likely to make the change? By examining the five classes of neighborhoods for 2000-2010 through a statistical analysis, researchers were able to determine which neighborhoods were most likely to transition between classes and which were most likely to remain at the same quality-of-life level across the decade. The results show that neighborhoods in classes one and five had the greatest chance of remaining at the same quality-of-life level, as they could only move in one direction (up or down, respectively). The results also show neighborhoods in class two as the most “mobile,” meaning they had only a 48 percent chance of remaining in the same class and were more likely to improve (30 percent) than decline (23 percent).
While these results are interesting, researchers suspected the economic downturn may have had an impact on changing neighborhood quality-of-life scores from 2000 to 2010. To confirm this suspicion, they segmented the decade into groups in order to examine changes at different periods of the decade. This analysis reveals a noticeable shift in the neighborhood change process, as metropolitan and country-wide economic conditions changed.
These effects are most apparent in the process of neighborhoods improving from the lowest quality-of-life class. Between 2000 and 2006, the probability of remaining in class one was 79 percent, with only a 21 percent chance of improvement. However, from 2006 to 2008, during the height of favorable economic conditions, the chance of improving from the lowest class rose to 47 percent, with only a 54 percent chance of staying in class one*. During the 2008-2010 time period, as the economic downturn began, the lowest quality-of-life neighborhoods essentially stopped their upward climb and reverted to their pre-2006 state, with the chance of remaining in class one rising to 83 percent.
Interestingly, this same analysis did not yield similarly negative impacts on the highest quality-of-life neighborhoods in the study. In fact, the probability of remaining in the highest quality-of-life class increased throughout the decade. These results show that in terms of neighborhood quality-of-life change, the economic downturn served to halt, or even revert, improvements made to the lowest quality-of-life neighborhoods during the start of the decade. As a further example, from 2006 to 2008, 14 neighborhoods in the lowest class improved to class two. In 2010, of those 14 neighborhoods, one continued its improvement trend and moved to class three; three neighborhoods remained in class two; 10 transitioned back down to class one.
After examining how the shifting economic climate affected neighborhood quality-of-life scores, researchers considered whether a neighborhood’s surrounding conditions also affected its overall quality of life and its likelihood to improve or decline. The results of this analysis indicate that neighborhoods indeed depend on their surrounding areas. The likelihood of improving increased for all classes when surrounded by better neighborhoods, and the likelihood of declining increased when surrounded by worse neighborhoods. For example, the probability of a class two neighborhood declining to class one nearly doubles when it is surrounded by class one neighborhoods (23 percent to 41 percent). Similarly, a class three neighborhood’s likelihood of declining to class two or one more than doubles from 22 percent to 50 percent when surrounded by class one neighborhoods. Likewise, the probability of improving is found always to be higher for a neighborhood when its neighbors’ values fell into a higher ranking, indicating that surrounding conditions are a major influence on the overall quality of life in Charlotte neighborhoods.
* Due to rounding, the percentages don’t add up to 100.
RENCI at UNC Charlotte researchers involved with the quality-of-life study include Ph.D. candidate Elizabeth Delmelle, Dr. Jean-Claude Thill and Dr. Chunhua Wang, representing the UNC Charlotte Department of Geography and Earth Sciences and a RENCI research partner, the UNC Charlotte Infrastructure, Design, Environment and Sustainability (IDEAS) Center. Other RENCI at UNC Charlotte researchers include Drs. Owen Furuseth and Thomas Ludden of UNC Charlotte’s Metropolitan Studies and Extended Academic Programs.
For this project, RENCI researchers used the Charlotte Neighborhood Quality-of-life Study to carry out their research. That study is a biennial report developed for the City of Charlotte by UNC Charlotte’s Metropolitan Studies and Extended Academic Programs unit under the direction of Dr. Owen Furuseth. It has been produced since 1997. This longitudinal report uses 20 variables covering social, physical, crime and economic dimensions for 173 neighborhood statistical areas (NSA) in Charlotte. A composite is derived from a statistical analysis for each NSA. The higher the quality-of-life score from the study, the higher the neighborhood’s quality of life.
Elizabeth Delmelle is a geography professor at UNC Charlotte. She can be reached at edelmell@charlotte.edu.
Sara Gleave wrote this article while a graduate student working at the UNC Charlotte Urban Institute in 2010-2014.
Elizabeth Delmelle & Sara Gleave
