CMS proficiency: Maps and trends

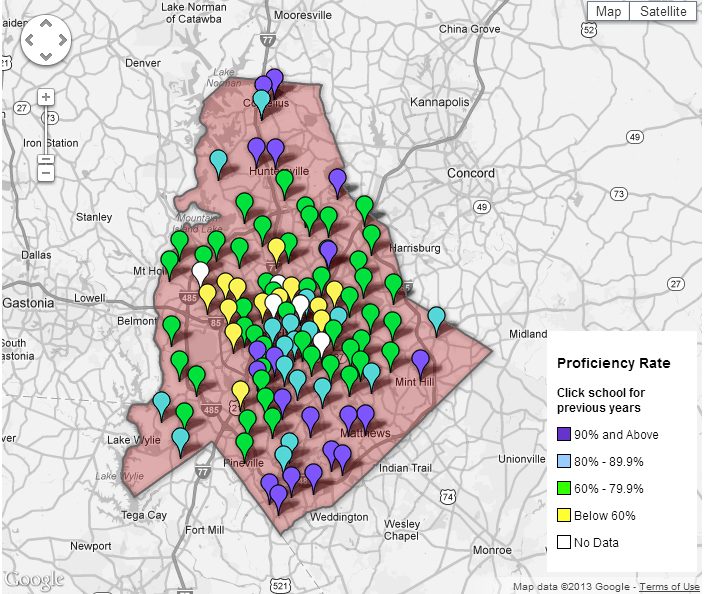
Maps of student scores reveal patterns of high achievement in northern and southern parts of Mecklenburg County and a more complex mix of high and low scoring schools within Charlotte. A closer look reveals that schools with big improvements since last year are scattered around the city.
As part of a continuing partnership with MeckEd, the institute has created maps of “proficiency” scores of CMS schools grouped by elementary, middle and high schools. Individual schools are shown with data from the 2011-2012 school year. The interactive maps allow you to select individual schools to see scores from both 2011-2012 and 2010-2011 (Click on the map image below to see the interactive maps at the bottom of this article).
2011-2012 Proficiency rates for CMS elementary schools (Click image for interactive maps)
| Similar maps of CMS high schools that show multiple measures along with analysis are available here. |
The composite proficiency rates shown in the map above (and in the interactive maps below) represent the percentage of the test scores in the school at or above grade level. An explanation of how these scores are determined is available here.
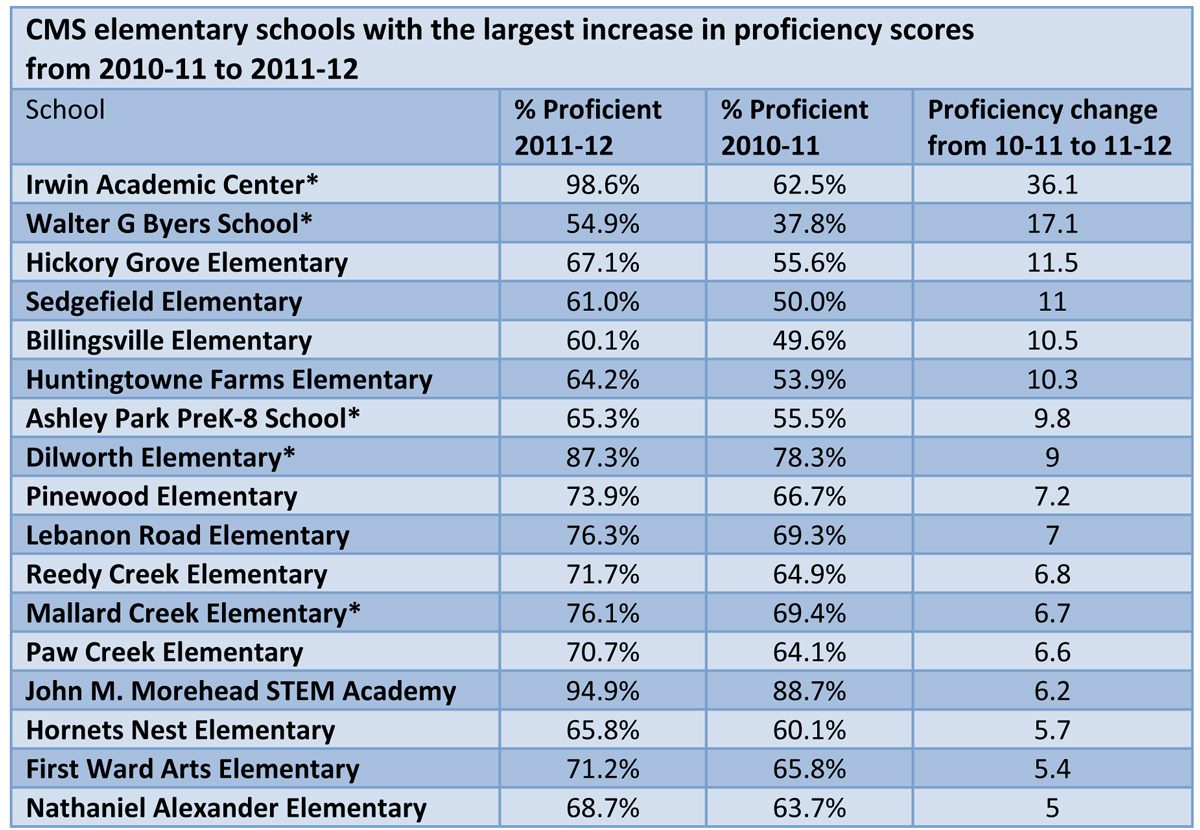
The table below shows elementary schools in CMS that saw an increase of 5 or more percentage points in their proficiency scores from 2010-11 to 2011-12. Atop that list is Irwin Academic Center, with a 36-point increase. The change at Irwin is related to the relocation of the district’s program for academically gifted students to the facility from Villa Heights in 2011.

The change at Irwin shows the effects that external decisions like district program relocations can have at individual schools. This should not take away from the achievements of schools where no such changes occurred. The table above notes where changes in program or grade alignment occurred. Other than the gifted and talented program move to Irwin, other changes made would not be as clearly related to the rise in scores the schools experienced. These included the realignment to K-8 grades at Byers and Ashley Park and the move of a magnet program from Dilworth.
Unfortunately not all schools saw proficiency rise from 2010 to 2011. Sterling Elementary saw the largest decline – a 17-point drop in proficiency scores (from 78.7 percent to 67.7 percent). Of elementary schools, 11 saw a drop of 5 points or more for that period, compared to the 17 schools shown in the table above with a 5 point or greater increase.
The interactive maps below let you compare individual schools in Mecklenburg County for elementary, middle and high schools. Click the tab to choose from among elementary, middle or high school, then select individual schools to see proficiency scores for the last two years.
Source: All data from the N.C. Department of Public Instruction.
- Elementary and middle school proficiency: Percent of all end-of-course scores (reading, mathematics and science) that are at or above grade level.
- High school proficiency: Percent of all end-of-course test scores (Algebra I/II, Biology, Civics and Economics, English I, History, Physical Science, and Writing) that are at or above grade level.
Full explanation of the proficiency composite score calculation is available here.
