2025 Schul Forum Community Data Day
by Charlotte Urban Institute Staff
On Thursday, April 3, 2025, the Charlotte Urban Institute + Regional Data Trust hosted the fifth Schul Forum at The Dubois Center at UNC Charlotte. As a day of community data, attendees explored how local data and research can be used to make a difference in our lives and communities. More than 200 engaged and curious community members attended the event earning the Institute its highest Forum attendance to-date.
The day started with four pre-forum Lunch & Learn sessions where attendees got to nosh and learn about tools offered by the Institute + Data Trust to make navigating and using community data more approachable. Below is what was covered in each session.
Use Our Tools
- The Charlotte-Mecklenburg Quality of Life Explorer – This session provided an introduction to the Charlotte-Mecklenburg Quality of Life Explorer, a collaboration between the City of Charlotte, Mecklenburg County, and the Charlotte Urban Institute. This free resource offers community members, researchers, and policymakers throughout the Charlotte region access to current data encompassing over 80 variables across nine distinct dimensions related to quality of life. Facilitator: Katie Zager.
- The Charlotte Regional Data Trust – During this session, attendees learned about the Charlotte Regional Data Trust, a distinctive data repository and nonprofit entity managed by the Charlotte Urban Institute. Attendees also learned that data held in the Data Trust is compiled and integrated from essential community services, including schools, housing organizations, law enforcement, and social service agencies. The session highlighted how these robust datasets can be utilized for research, planning, and evaluation purposes within the community. Facilitators: Sydney Idzikowski, Nick Occhipinti, and Angelique Gaines.
- Impact, Data and Evaluation Academy (IDEA): Logic Models 101 – Attendees at this session learned about IDEA’s mission to offer affordable, community-focused data and evaluation training specifically tailored for Charlotte-area nonprofits. The session addressed the critical need for nonprofits to manage and understand their data to answer key questions about data relevance and program impact. Facilitators Bridget Anderson and Rosalyn Allison-Jacobs discussed that the academy aims to overcome barriers such as time and expertise, which can prevent nonprofits from effectively using their data. Specifically, the session simulated an “Evaluation Explorations” classroom experience, where facilitators guided attendees through the process of developing a logic model. Participants learned that a logic model serves as a visual roadmap connecting an organization’s resources, activities, and outcomes.
- Carolinas Regional Explorer Listening Session – This session provided an overview of the Carolinas Regional Explorer, a new web application that expands on the model of the Charlotte-Mecklenburg Quality of Life Explorer to cover a 14-county region in North and South Carolina. Attendees learned that this tool offers a detailed, census tract-level view of demographics, places, and trends across the metropolitan area. The session highlighted the Explorer’s analytic features, which enable users like residents, policymakers, researchers, and advocates to identify spatial patterns and correlations in areas such as education, economy, health, and housing. Participants experienced a demonstration of the current and planned features for the Explorer and learned about the development roadmap. Facilitators: Kailas Venkitasubramanian, Ph.D., and Liz Morrell, Ph.D.
Poster Session & Snack Reception
The snack and poster session provided attendees a perfect opportunity to review community research projects managed by Institute researchers, ask questions, network with community members, and make new connections.
So What?! Sessions
After a welcome by Byron P. White, Ed.D., associate provost of Urban Research and Community Engagement with urbanCORE, the So What?! Sessions, provided fast-paced, application-oriented overviews of local data tools and types of data resources. Attendees got to hear about the:
- City of Charlotte’s Open Data Portal – Andrew Bowen, innovation and data officer with the City of Charlotte, explained how the portal came to be and how it can used to answer community questions, validate experiences, and improve transparency.
- The Charlotte Heat Mappers – Joe Wiswell, graduate research assistant in the Department of Earth Environmental, and Geographical Sciences at UNC Charlotte, discussed the 2024 Charlotte Heat Mapping campaign, which investigated temperature variations within central Charlotte. They discovered that significant temperature differences, up to 18°F, can exist within the city, leading to increased heat-related stress in hotter areas. Wiswell explained the methodology used by the Charlotte Heat Mappers and their team of community scientists to conduct the study. Attendees gained key insights from the campaign’s findings regarding urban heat islands in Charlotte.
- The Benefits Cliff Calculator – This presentation, presented by Justin Taylor, stakeholder engagement manager at Goodwill Industries of the Southern Piedmont, delved into the Benefits Cliff Employer Pilot program, the financial ramifications of wage increases and explored innovative strategies to mitigate the impact of the benefits cliff, fostering economic growth and mobility for lower-wage workers.
- and The Opportunity Compass – In this presentation, led by Kymberly Byrd, Ph.D., community research and engagement manager, and Virginia Covill, Ph.D., deputy director of strategy and operations, both of Leading on Opportunity, attendees learned about the Opportunity Compass — a tool designed with three primary goals: to define the key factors that drive economic mobility, to assess whether progress is being made in the right direction, and to facilitate alignment for action on this issue.
The So What?! Sessions concluded with a Q&A session moderated by Asha Ellison, director of research translation and engagement at Institute + Data Trust, before handing the floor to Lori Thomas, Ph.D., executive director of the Institute + Data Trust to kick off the keynote session.
Reframing Wealth Keynote Presentation & Discussion Panel
Schul Forum 2025’s keynote session featured Lamar Gardere, executive director of The Data Center in New Orleans, and Victor Amaya, Ph.D., president and executive director of Data You Can Use in Milwaukee. Mr. Gardere presented The Data Center’s development of a local wealth measure and discussed its application in the New Orleans region to focus on quality of life and thriving. He emphasized that while committed to closing the racial wealth gap, their approach also recognizes the immediate function of wealth as the capacity to thrive for everyone.
Dr. Amaya shared Data You Can Use’s experience applying this local wealth measurement methodology in Milwaukee. He presented initial findings, discussed its applicability in a different local context, and highlighted its use, particularly in their youth engagement efforts.
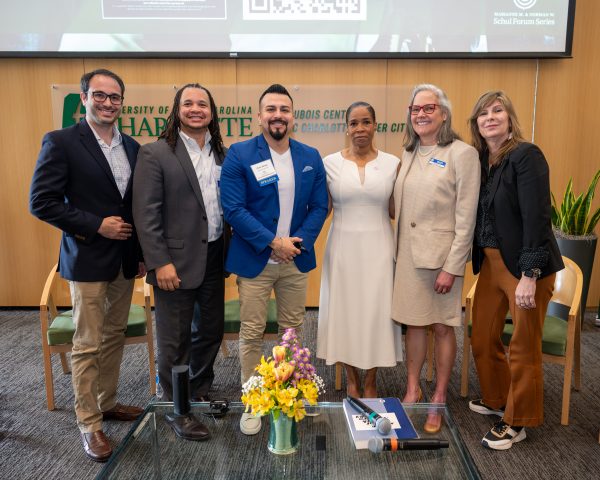
Following these presentations, Mr. Gardere and Dr. Amaya were joined by Kathryn Firmin-Sellers, president and CEO, United Way of Greater Charlotte, Christina Danis, Ph.D., director of community economic development, Centralinas Regional Council, and Robyn Hamilton, president and CEO, Urban League of Central Carolinas, for a panel discussion. Moderated by Ely Portillo, executive editor, WFAE, the panelists offered perspectives on the significance of wealth for quality of life in the Charlotte region.
Following the keynote session, a closing reception was held for the Gambrell Faculty Fellows.