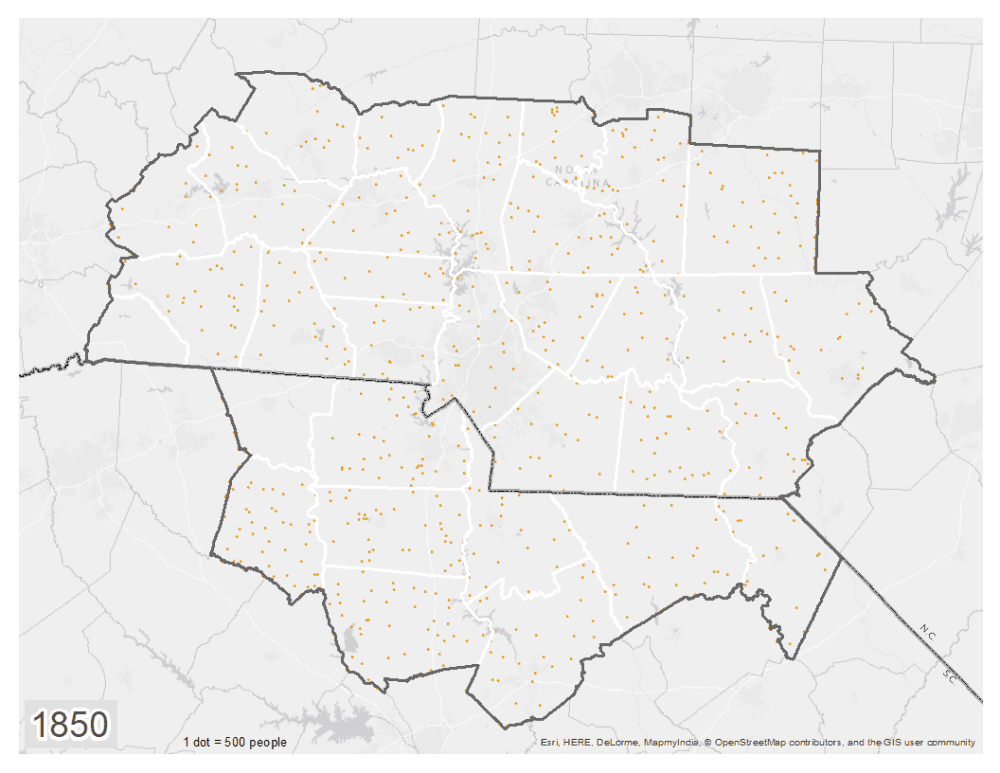
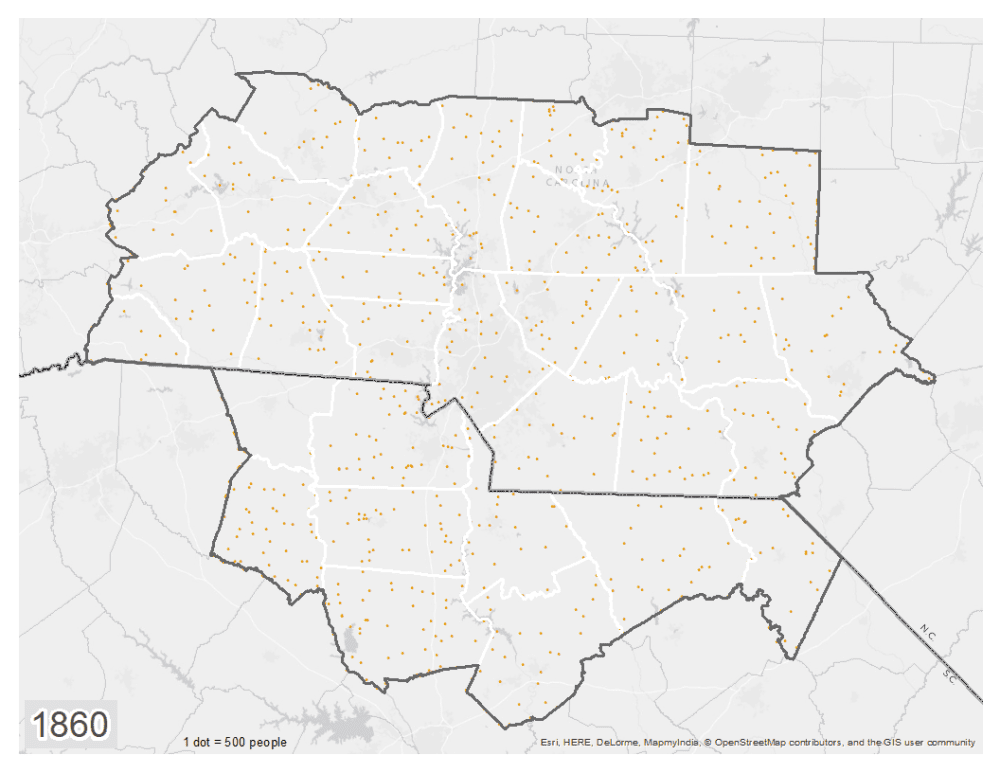
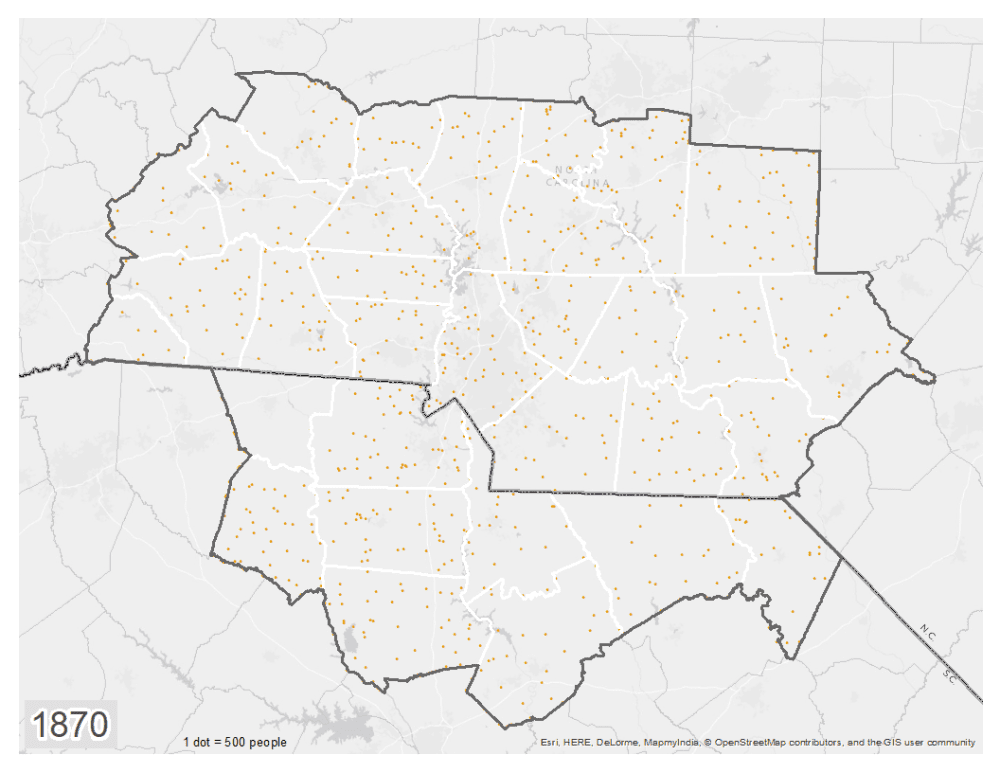
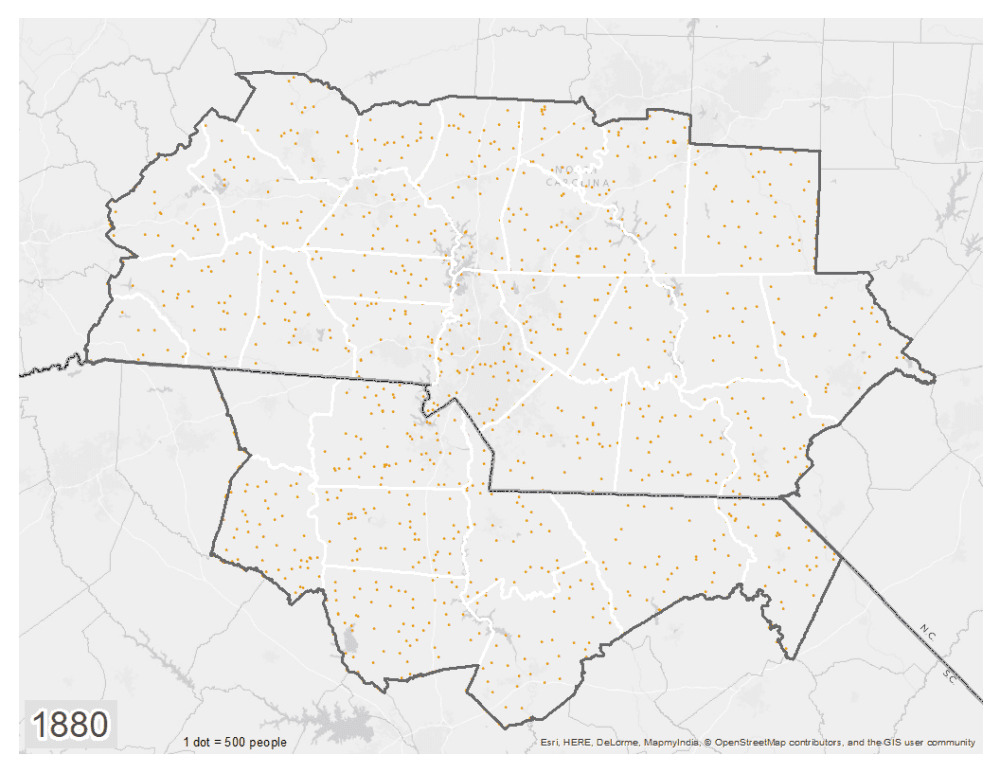
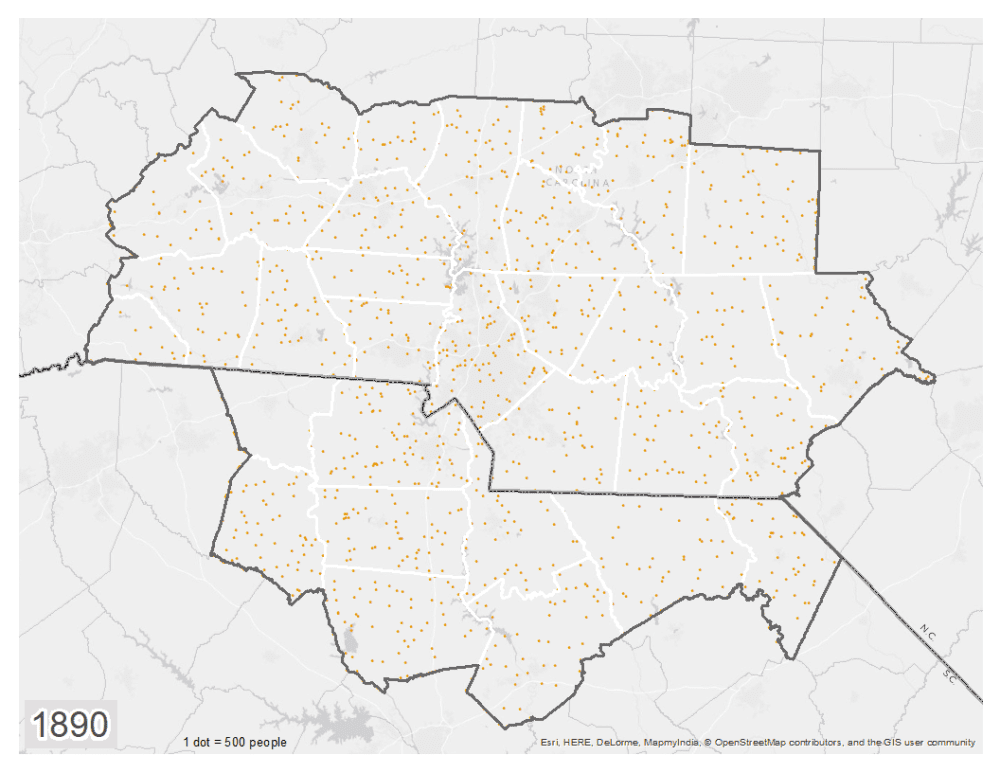
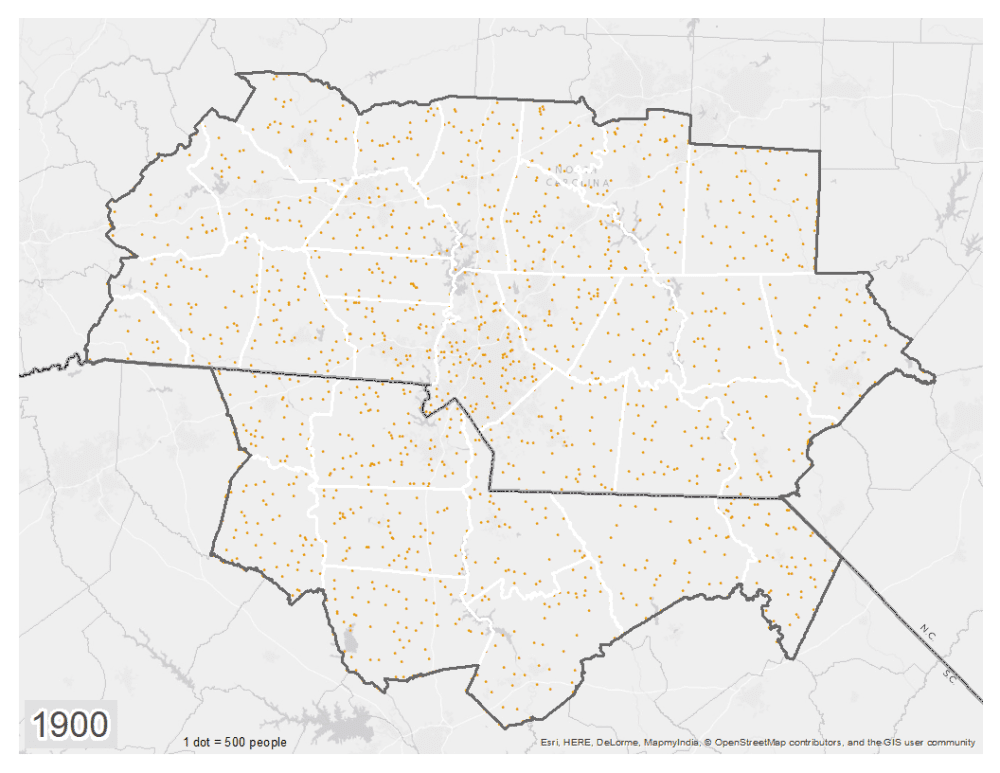
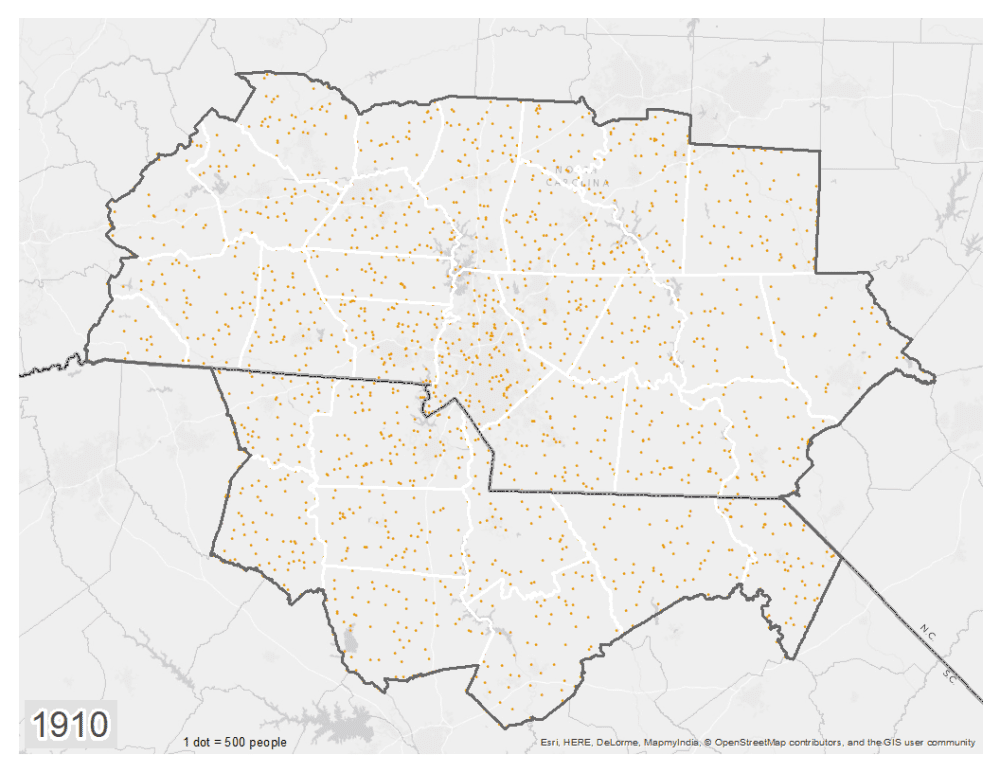
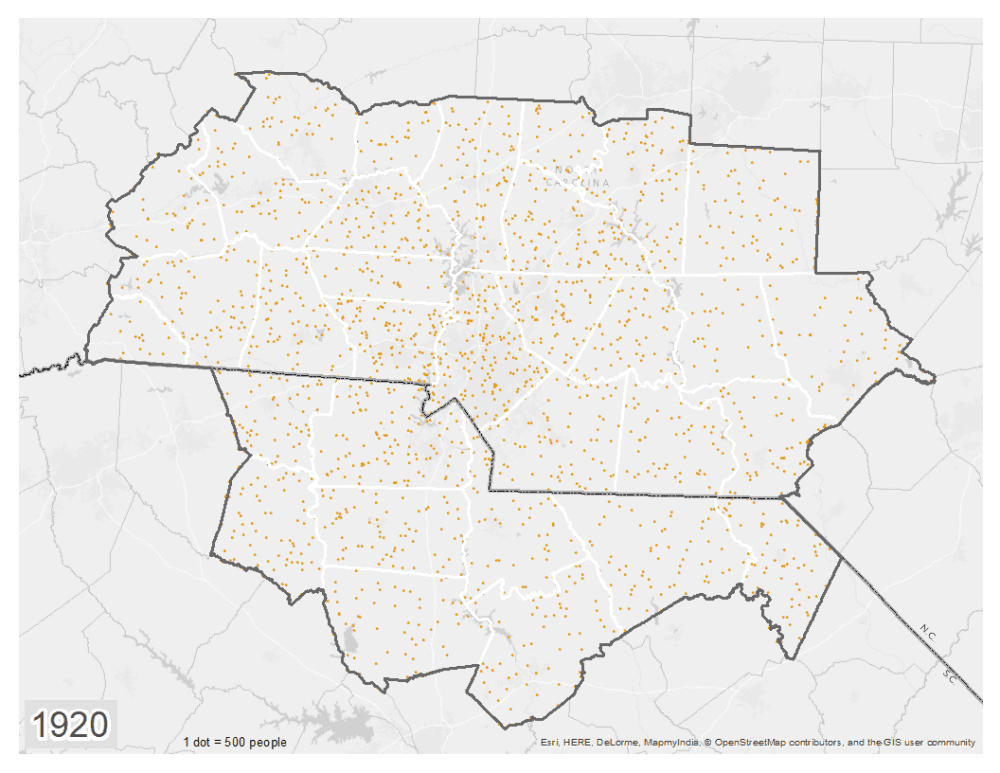
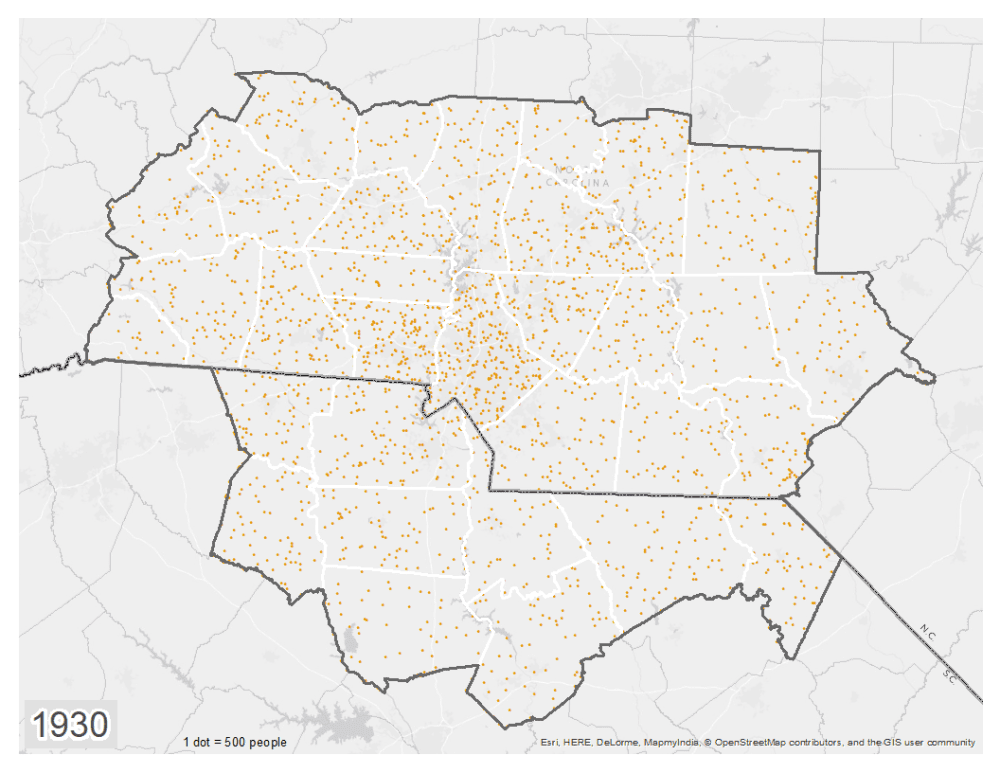
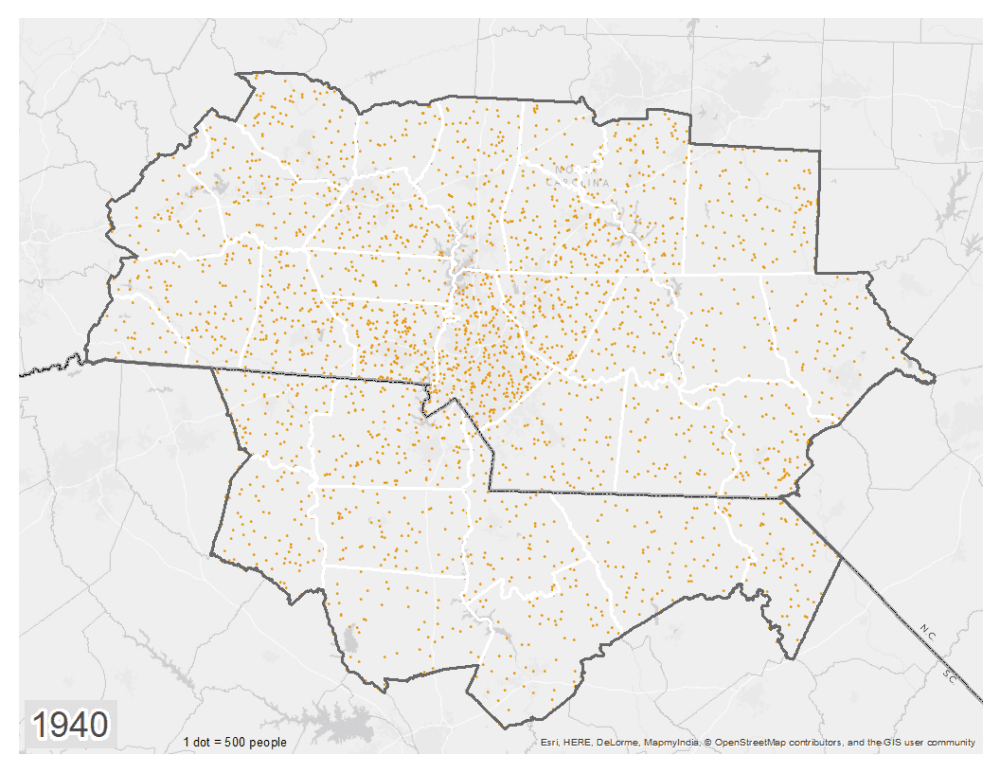
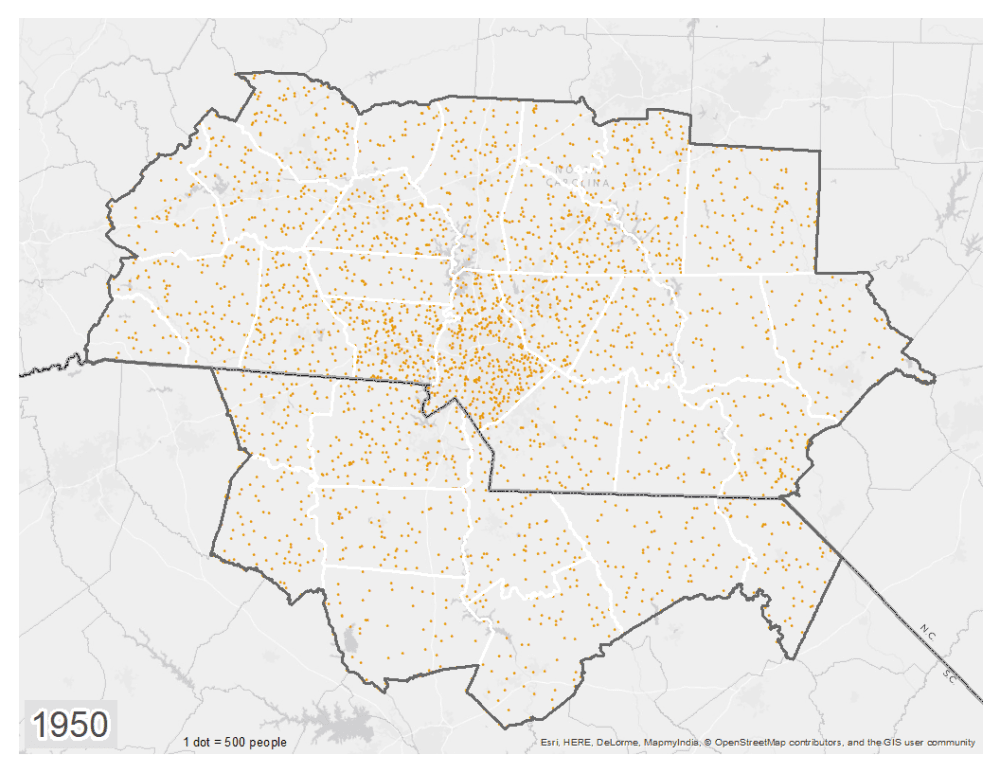
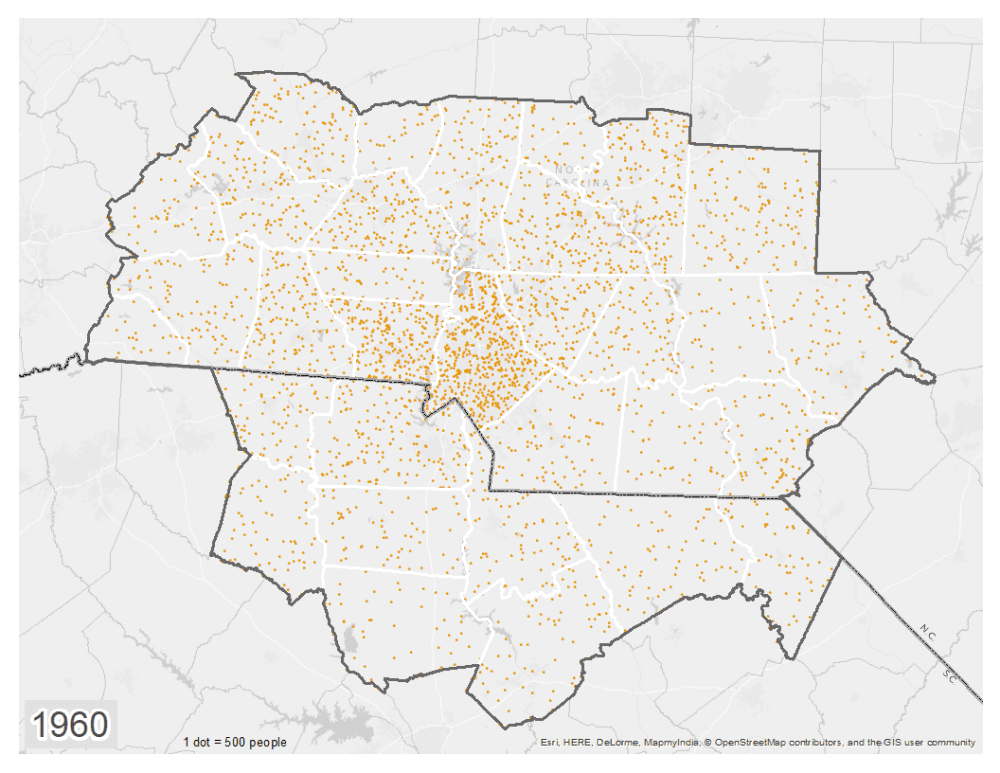
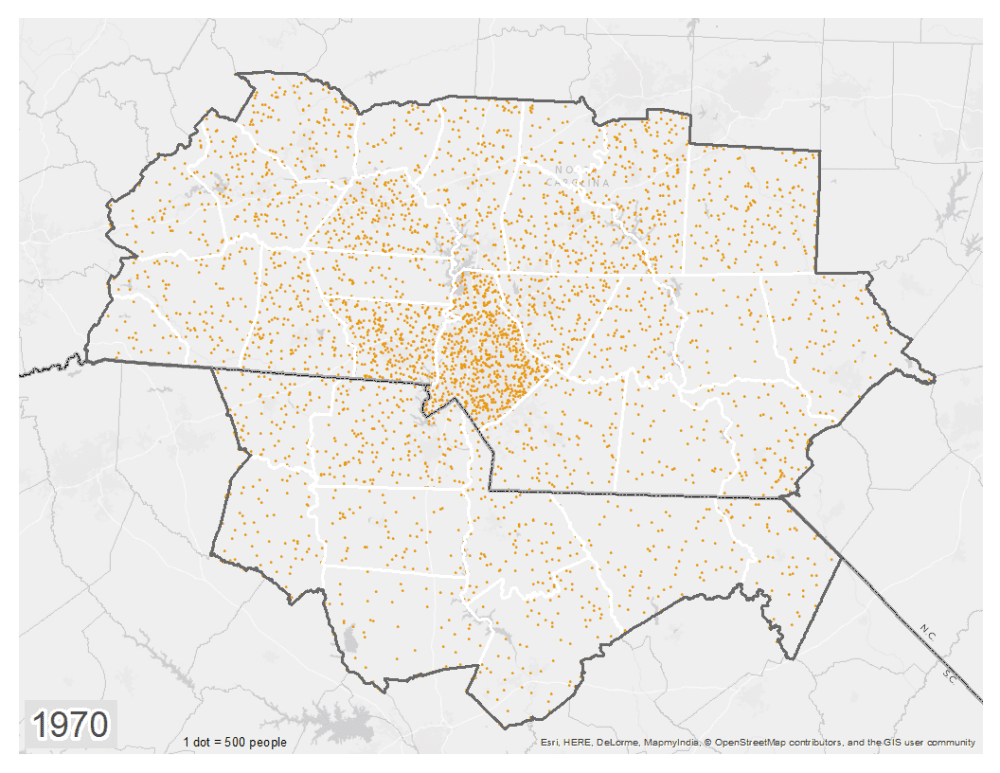
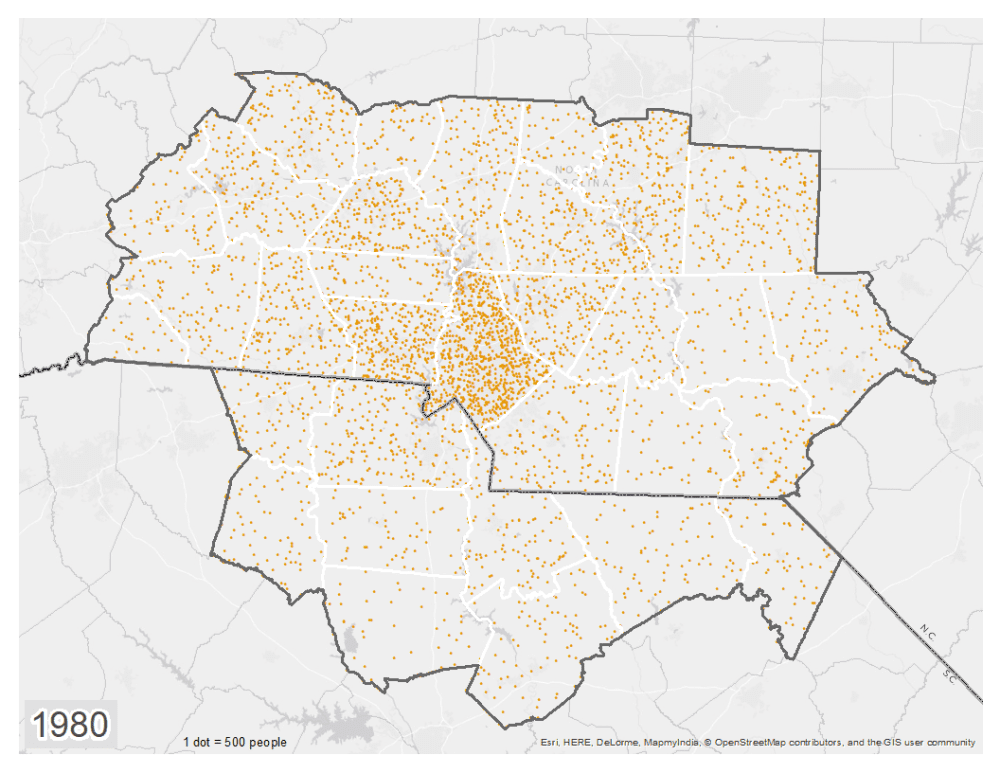
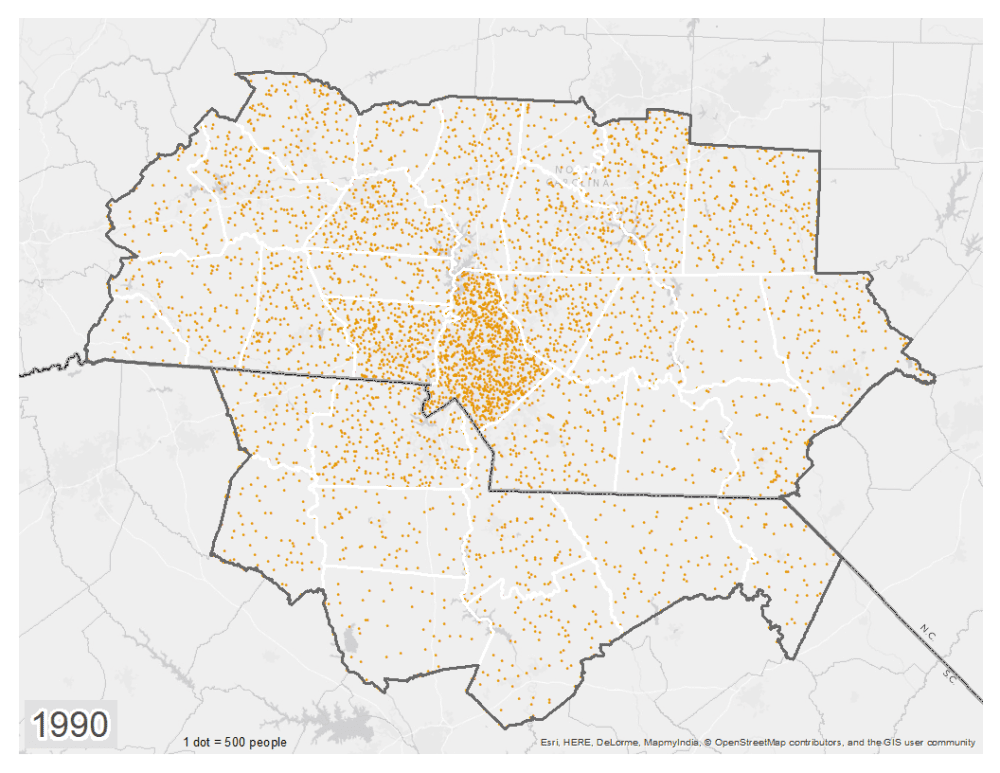
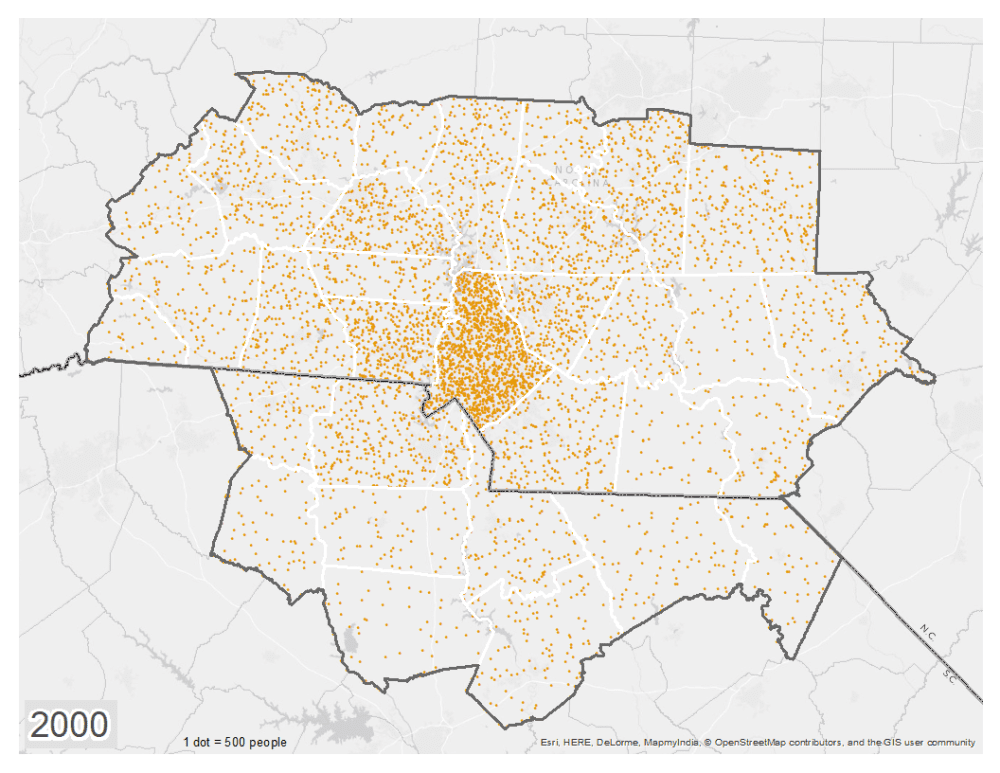
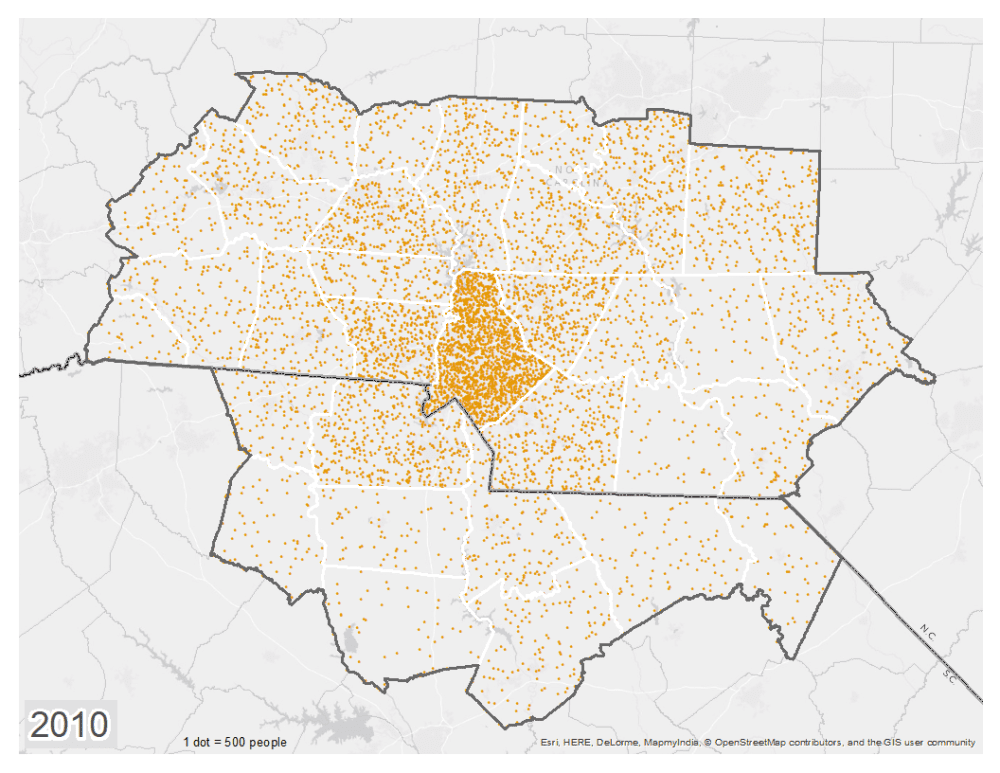
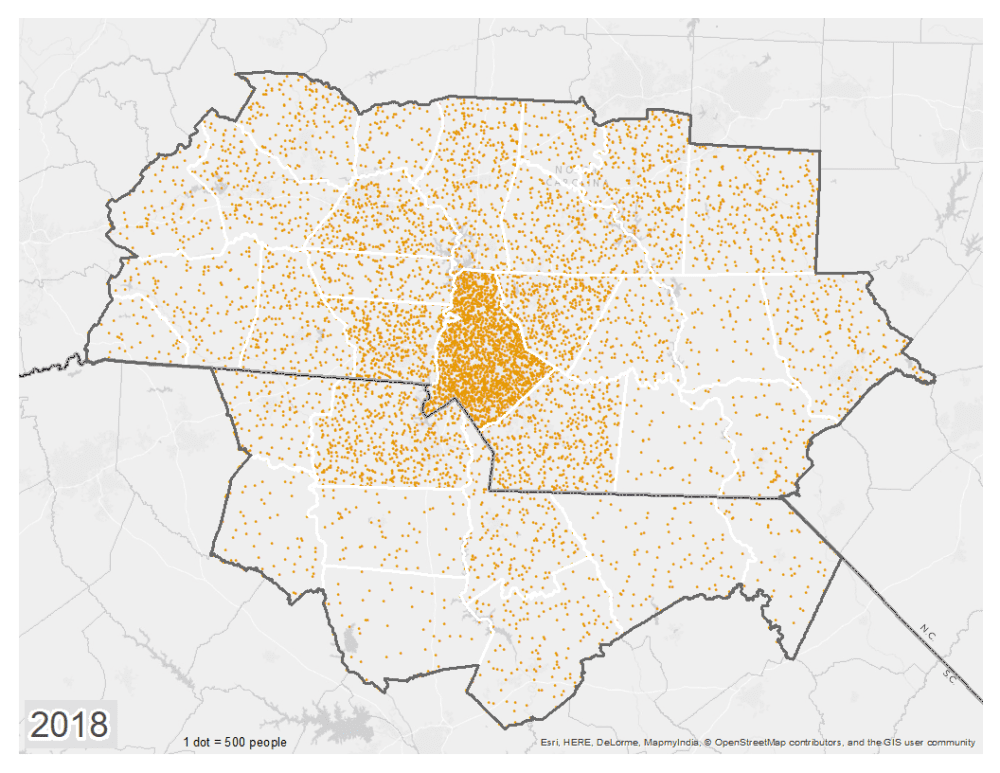
Population growth in the 32-county study area starting in 1850
Clayton Hanson & Laura Simmons | Aug 26, 2019
Click anywhere on the map below to pause and play. Each dot represents 500 people. The dots are distributed randomly within each county and are not intended to correspond to specific places, but instead to give a general sense of the number of people residing in each county over time.