Explore new data about Charlotte via interactive maps
By Katie Zager
The Quality of Life Explorer — Charlotte-Mecklenburg’s source for more than 80 interactively mapped variables about the economy, environment, demographics and more — has been updated with new information allowing you to explore our community.
Maps that rely on data from the U.S. Census’ American Community Survey are now up-to-date. This includes variables such as median age, household income, education level, home ownership and the share of commuters driving alone. The Quality of Life Explorer also includes, for the first time, interactive mapping of high-speed internet access in different parts of Charlotte-Mecklenburg.
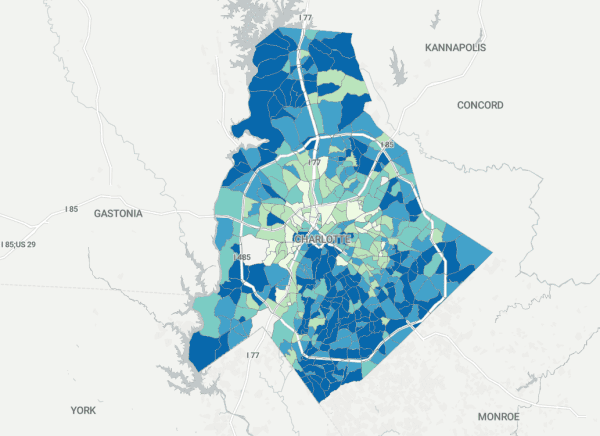
Many of the Quality of Life Explorer maps illustrate the familiar “crescent-and-wedge” pattern of disparities in Charlotte: Higher incomes, education levels and other socioeconomic factors are clustered in the wealthier southeast “wedge” of Charlotte, while the “crescent” of neighborhoods east, north and west of uptown have lower levels. This reflects historic and current patterns of residential segregation in Charlotte.
The Quality of Life Explorer maps are free to use. They include explanatory context and additional resources, and can be embedded on external websites. The Explorer is produced created in by the city of Charlotte, Mecklenburg County and the UNC Charlotte Urban Institute. (Note: Due to boundary changes in the Census, some neighborhood profile area boundaries have changed in the latest update. The most noticeable change is in uptown, which is now reported as a single unit. Contact Katie Zager with any questions.)
Some of the updated maps Include the following:
From the Quality of Life Explorer: “Nearly ten percent of households in Mecklenburg County or about 110,000 people have no internet access at all and 24.8% don’t have broadband access. Broadband is an essential amenity, but the cost of service is a major barrier. This lack of access has disproportionately affected some communities more than others. Broadband access is highly correlated to a variety of demographic and economic factors, particularly income and race.”
From the Quality of Life Explorer: “Household income is the sum of incomes for all inhabitants in a household. It provides an indication of how well households – instead of individual earners – are doing financially, which many service providers and retailers look at to help them locate their services. Incomes are closely related to levels of educational attainment and unemployment rates, and also vary significantly by household type and size, age, race, and ethnicity. Improvements in neighborhood income over time may indicate that residents’ incomes have improved, or that a neighborhood’s demographic composition has changed, with higher income households moving in or lower income households moving out.”
From the Quality of Life Explorer: “Educational attainment varies widely by age, family income, and race and ethnicity. At the neighborhood level, differences in educational attainment can persist across generations, as children living in neighborhoods with high adult educational attainment tend to have greater exposure to the world of work and higher expectations for their own education and employment prospects.”
From the Quality of Life Explorer: “The median age in Mecklenburg County is 35.1, compared to 38.7 in North Carolina and 38.1 in the United States. While the nation as a whole is rapidly getting older, the median age in Mecklenburg has risen only marginally, due to growing families, high levels of international migration, increasing university enrollment, and attraction of young professionals to the area.”
From the Quality of Life Explorer: “The rate of homeownership is closely tied to the share of the housing stock available to own rather than rent, household size and composition, and demographic characteristics such as age, income, race/ethnicity and education.”
Visit the Quality of Life Explorer to see the full range of interactive maps.