Free versus reduced lunch applications
The UNC Charlotte Urban Institute is providing weekly maps and data dashboards to highlight relevant statewide education statistics for EducationNC, a nonpartisan, nonprofit news source aiming to create a bipartisan, statewide conversation about public schools. Learn more about this new initiative here.
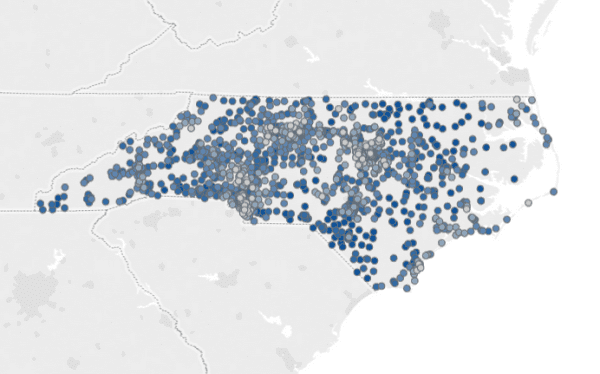
This week’s EdMap allows you to explore differences in free and reduced lunch applications at the school level.
This week the maps take a closer look at free and reduced-price lunch applicants in elementary schools. While students who apply for free and reduced lunch are often grouped together, there is a significant difference in the percent of free lunch applicants compared to reduced lunch applicants in many schools throughout the state. The maps illustrate the locations of free lunch applicants and reduced lunch applicants separately, to allow users to visualize these differences.
The Statewide tab allows you to view the percent of free lunch applicants at the school level across the state. Schools with high percentages of free lunch applicants are scattered throughout the state but more concentrated in the southeast and northeast regions of North Carolina. In contrast, areas with few free lunch applicants are more concentrated near urban centers in the Charlotte region, Guilford County, the Triangle area and along the coast in New Hanover County.
Use the dropdown menu above the map to view reduced lunch applicants, and you can see how reduced lunch applicants at the school level make up much smaller percentages of applicants compared to free lunch applicants. There is no distinct pattern regarding the concentration of reduced lunch applications.
To view schools in a single district, click on the second tab. The map provides the percentage of free and reduced lunch applicants and the chart illustrates the composition of free reduced lunch applicants. Selecting a school on the map or chart will highlight its location and display the exact percentage of free or reduced lunch applicants from the total percentage of both in a school. As you look at schools at the district level, note that the vast majority of applicants apply for free lunch rather reduced lunch.
Definitions:
Free and Reduced Lunch Applicants: The students who apply for free and reduced-price lunch. Note that any student who resides in a household that has already applied for and received free and reduced lunch is also eligible.
Free and Reduced Lunch Income Guidelines: The income guidelines for households applying for free and reduced lunch are prepared by the USDA Food and Nutrition Service School Meals program.
For children to receive reduce meal prices, the household where they reside must have a household income no more than 185 percent of the federal poverty line. For a child to qualify for free meals, the household must have a household income no more than 130 percent of the federal poverty line.
For additional information in addition to the chart in the text, please refer to http://www.fns.usda.gov/sites/default/files/2014-04788.pdf.
Staff