Gaston, onetime manufacturing heavyweight, now lags Union

Local perceptions may not have caught up with the new reality in the Charlotte region’s manufacturing economy. Even before the recession began in 2007, declines in the textile and furniture industries were changing the structure of local employment. As the downturn continued, counties that depended less on textile and furniture manufacturing lost fewer jobs. The result: Several counties traditionally considered centers of manufacturing employment, such as Gaston, now have a smaller percentage of jobs in manufacturing than fast-growing Union County.
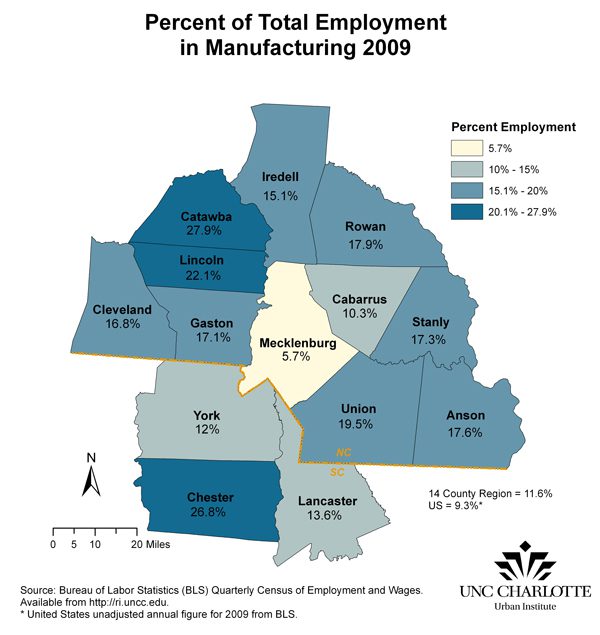
The map below shows the percentage of employment in manufacturing in 2009 in each of the 14 counties in the Charlotte region. Only Mecklenburg’s percentage (5.7 percent) is below the 2009 national average, 9.3 percent.1 Other counties range widely from a little more than 10 percent in Cabarrus to nearly 28 percent in Catawba.

Among counties adjacent to Mecklenburg, Union and Gaston highlight the dramatic shifts occurring in the local economy. Gaston, traditionally one of the nation’s largest textile centers, has long been associated with industry and manufacturing. On the other hand, Union – which experienced rapid residential growth in the last decade, becoming the fastest growing county in the two Carolinas since 2000 – has been considered more a bedroom suburb than a manufacturing center.
In 2000, Gaston County had more than 25,422 manufacturing jobs compared with 12,712 in Union.2 During the decade, textile manufacturing suffered a much greater decline than food manufacturing and processing that have been important in Union’s economy. By 2009, employment in Union’s manufacturing sector was down nearly 9 percent compared to a drop of 16 percent in Gaston. While that leaves slightly more total manufacturing jobs in Gaston than Union (10,882 compared to 10,348)2, as a percentage of all employment, Union is near 20 percent compared to 17 percent in Gaston. The table below shows the relative change in manufacturing employment across the region.

Union, without the strong tradition of employment in either the textile or furniture industries, consistently has had the lowest unemployment rate in the Charlotte region since the recession began. Gaston, which had to transition through the decline in textile employment in addition to the setbacks of the recession, experienced higher unemployment rates. By 2010, however, Gaston’s rate was below 10 of the 14 regional counties.3
Since many people in the region do not work in the county where they live, the way that employment is evolving cannot be described just by looking at jobs within individual counties. With manufacturing, however, employment dropped everywhere in the region. That means that as people lost jobs in that sector they were less likely to find other manufacturing jobs elsewhere in the region. The result: Manufacturing declined as an employment sector throughout the region.
While much attention focused on the financial sector’s effect on the Charlotte region during the recession, employment losses in manufacturing have been a larger issue for many regional counties. Rural counties such as Anson, Chester and Lancaster, with high percentages of manufacturing employment in 2000 (over 30 percent)2, have experienced some of the highest unemployment rates in the region during the recession.3
The trend for the Charlotte region is toward manufacturing employment more reflective of the nation. In 2009, the 14-county Charlotte region had manufacturing employment of 11.6 percent, compared to 9.3 percent nationally. Job statistics for Charlotte’s Metropolitan Statistical Area or MSA (Mecklenburg, Anson, Cabarrus, Gaston, Union and York) show manufacturing at 8.6 percent in 2009. That puts the MSA below the national average and reflects a larger decrease here since early in the decade, compared with benchmark MSAs around the country.
The UNC Charlotte Urban Institute has created online tools through the Charlotte Regional Indicators Project to help make sense of these kinds of changes in topic areas such as health, environment, housing, transportation and demographics. The regional sector employment percentages used in this report come from economic interactive tools available online. The site, http://ri.charlotte.edu also allows visitors to compare Charlotte to other MSAs around the country.
Photographs by Nancy Pierce
1 Bureau of Labor Statistics (BLS) unadjusted annual figure for 2009.
2 BLS quarterly census of employment and wages (QCEW).
3 Based on unadjusted annual unemployment data from BLS.