High school graduation rate demographics by school for 2013-14
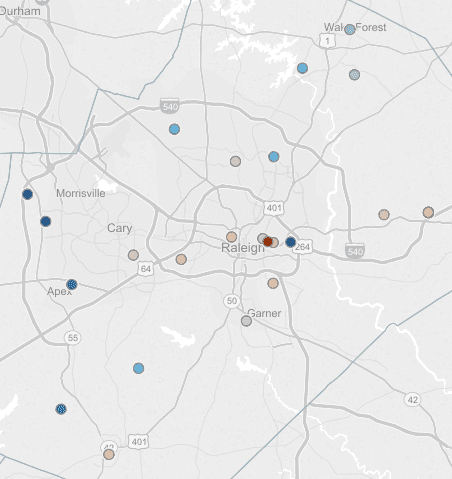
This week’s map shows high school graduation rates at the school level and presents the latest numbers for various demographic groups.
Choose a district and demographic group from the menu to the right of the map to see the rates for students of a particular race/ethnicity, sex, socio-economic status, English proficiency, or gifted status. Schools in blue are above the state average for all students (83.9 percent), and those in orange are below. For a full list of all high schools in the district, see the table to the right of the map.
The UNC Charlotte Urban Institute provides weekly maps and data dashboards to highlight relevant statewide education statistics for EducationNC, a nonpartisan, nonprofit news source aiming to create a bipartisan, statewide conversation about public schools. Learn more about this initiative here.
Staff