The highs and lows of high school graduation rates

Charlotte-Mecklenburg high schools have some of the region’s highest graduation rates. They also have some of the lowest. A look at recently released public high school graduation rates for North Carolina shows a wide disparity in Charlotte-Mecklenburg Schools. Yet CMS as a whole, compared to other systems in the region, has the lowest overall graduation rate, 72.2 percent. The new data showed improvement for N.C. students from the previous year and a continuted, gradual increase over the past several years. But numbers vary greatly between local districts, and between racial and ethnic groups within districts.
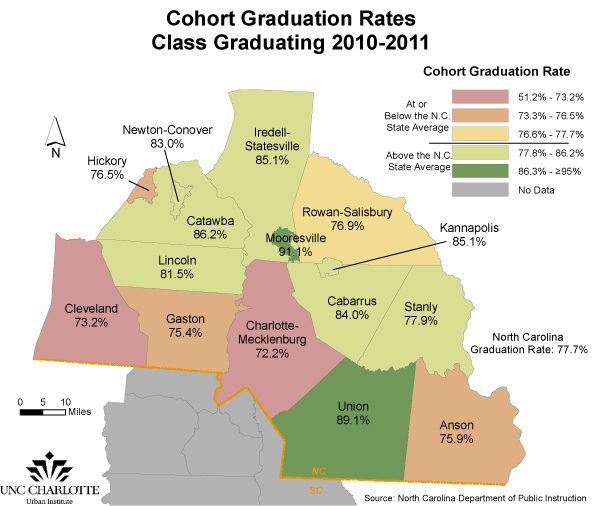
The map below shows the district-wide, four-year cohort graduation rate* for the N.C. districts in the Charlotte region. Most school systems in the region exceed the state’s overall 2010-2011 graduation rate, 77.7 percent. Exceptions are Anson, Charlotte-Mecklenburg, Cleveland, Gaston, Hickory City and Rowan-Salisbury schools.

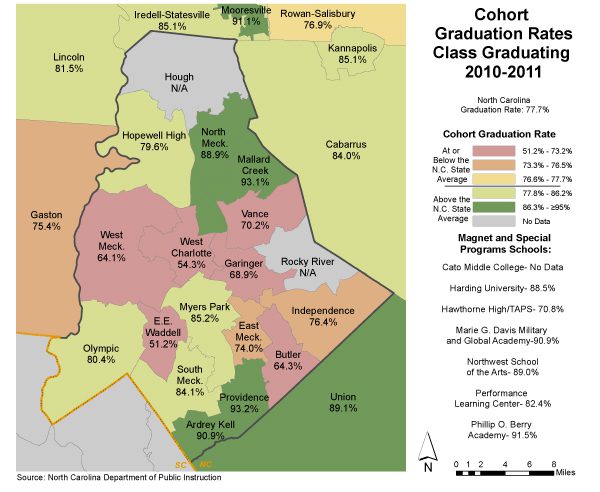
While there is variation in graduation rates among the high schools within all the school districts, CMS has a particularly wide range of graduation rates if individual high schools are compared. The second map shows the graduation rates by high school district zones in Mecklenburg County. The map highlights the northern and southern CMS high schools that have much higher rates than schools across the county’s center, and that meet or exceed the rates of nearby suburban counties. (Note: Two new high schools opened in 2010-2011 in CMS, so those schools did not have graduating classes in 2010-2011).

This is just one example of the ways that the large, unified county districts common in North Carolina can be difficult to understand by using average values across the whole population. In many parts of the United States, districts are much smaller, and statistics such as graduation rates are more reflective of typical schools in the district. In CMS, the average rate of 72.2 percent is not typical of many of the individual schools. Most have much higher, or much lower, rates than the average.
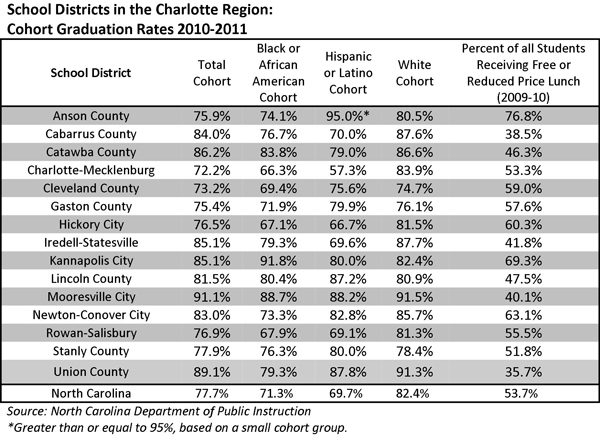
Graduation rates for different groups of students also vary widely, both in CMS and in surrounding districts. The table below shows several subgroups’ graduation rates, with the district’s percentage of students on Free or Reduced Lunch (FRL), a statistic commonly used to measure poverty.

While districts in the region that have lower poverty tend to have graduation rates above the state rate for all subgroups (Cabarrus, Mooresville and Union), several districts with higher poverty rates also have high graduation rates. Kannapolis City and Newton-Conover have poverty rates above the state average but also score above the state average in graduation rates for the combinded cohort as well as black and Hispanic cohorts.
CMS graduation rates are above the state average for white students (compared to the white student cohort rate for the state), but below the state rates for black and Hispanic students. The opposite is true in Anson, Gaston, Lincoln and Stanly, where white students graduate below the state average, but black and Hispanic students have rates above their respective cohorts’ state averages.
Graduation rates and other measures of education for the Charlotte region are availble on this web site. Education data can be graphed interactively by clicking here.
Maps by Keith Waters
Photograph by John Chesser
*Four-year Cohort Graduation Rate is the percent of students who entered ninth grade in a particular year and who graduated four years later. Source: North Carolina Department of Public Instruction (http://ayp.ncpublicschools.org/)