How’s drive time? Mapping Meck commutes

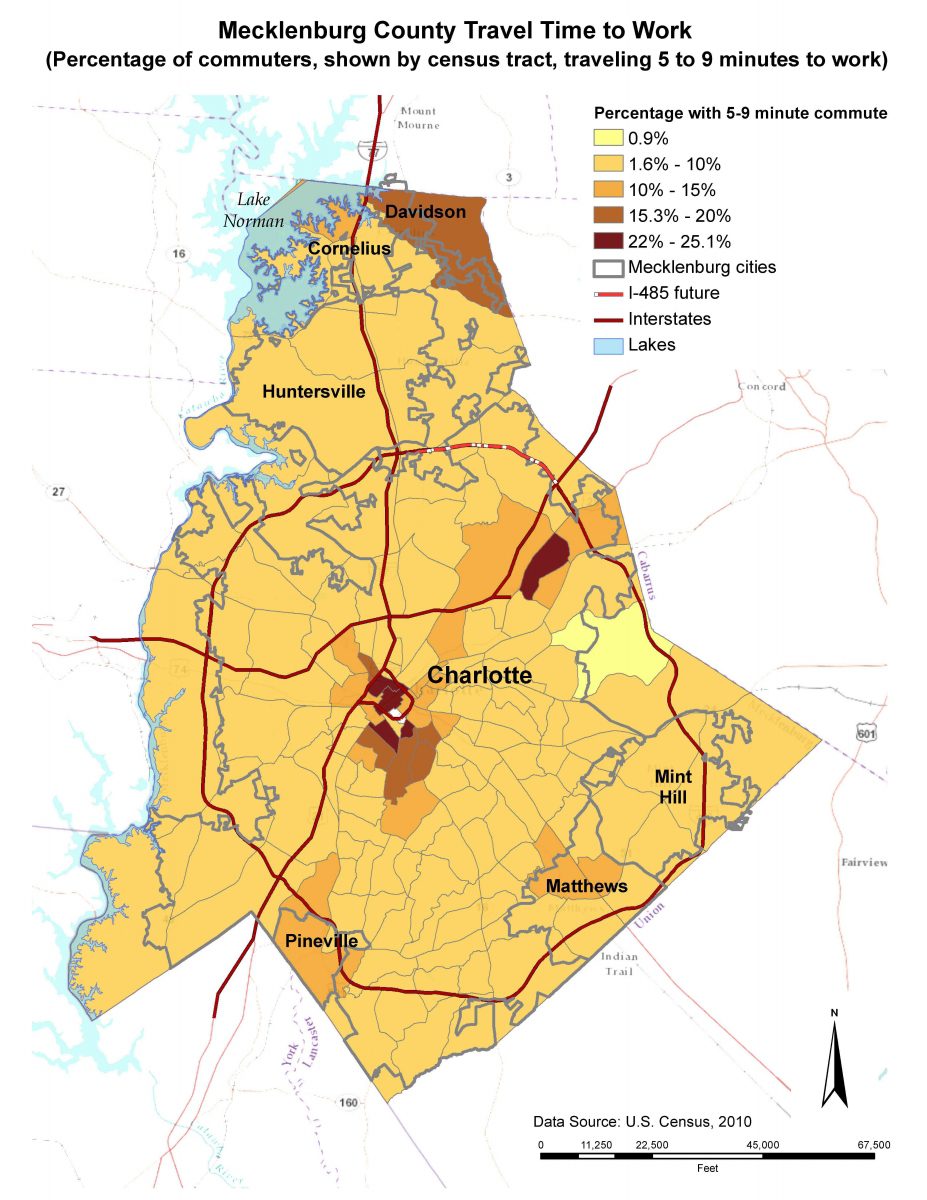
Commuting stories – we’ve all got one. Some are worse than others. Mecklenburg commutes are some of the worst in the nation. How does your commute time stack up? The maps below use 2010 U.S. Census data to break down average commute times into five-minute intervals (with the exception of the three highest categories) by percentage.
Commute Times
5 to 9 min10 to 14 min15 to 19 min20 to 24 min25 to 29 min30 to 34 min35 to 39 min40 to 44 min45 to 59 min60 to 89 min90 and up min

The maps show that a significant percentage of commuters in the southeast part of the county spend between 45 to 89 minutes traveling to work. Commute times ranging from 5 to 15 minutes are clustered around the uptown area, and those outside Charlotte’s city limits typically have the longest commute times in the county.
For most large U.S. cities, Friday afternoon commutes are often the worst; and in Charlotte, it’s no different. The traffic research firm INRIX used data to rate Friday afternoon traffic delays in 100 cities for Governing magazine. Charlotte’s Friday afternoon commute is ranked the 24th worst in the country, just behind Dallas, Atlanta and Denver, with Raleigh coming in at number 44. At the top of the list are cities like Los Angeles, New York, and Seattle.
As reported in the online magazine The Daily Beast, other INRIX reports rank the section of I-485 eastbound from N.C. 49 to N.C. 51 to be the 29th worst (out of 35) in the nation at rush hour. At its slowest, this  stretch adds 11 extra minutes on average to Thursday commutes between 5 and 6 p.m. Independence Boulevard at Stallings Road made the 2010 worst list at number 35, logging 12 bottlenecked hours a week in a mere 0.75 mile-long leg.
In addition to local commuters, the Charlotte Chamber’s “Drive Times” says that “each day, more than 150,000 individuals drive to work in Mecklenburg County from outlying communities. These commuters amount to nearly 30 percent of the total Mecklenburg workforce.”
An unexpected finding from the INRIX 2012 report, though, “shows a 30 percent drop in traffic across the country over the past year,” writes The Daily Beast. “The reasons, according to INRIX’s Jim Bak, include rising fuel prices, relatively few jobs created in urban areas, and the completion of stimulus projects resulting in less road construction.”
The latest U.S. Census data reports Mecklenburg County’s mean travel time to work to be 24.7 minutes over the period between 2006 to 2010, slightly higher than the state mean of 23.4 minutes. About 10 percent of the state’s population lives in Mecklenburg County, and the county’s population is growing rapidly. Along with that, do we have increasing commute times ahead of us as well?
$(document).ready(function() { $(“.5-9min”).click(function(){ var select_val = $(this).val(); $(“img#imgComVal”).attr(“src”, select_val); }); $(“.10-14min”).click(function(){ var select_val = $(this).val(); $(“img#imgComVal”).attr(“src”, select_val); }); $(“.15-19min”).click(function(){ var select_val = $(this).val(); $(“img#imgComVal”).attr(“src”, select_val); }); $(“.20-24min”).click(function(){ var select_val = $(this).val(); $(“img#imgComVal”).attr(“src”, select_val); }); $(“.25-29min”).click(function(){ var select_val = $(this).val(); $(“img#imgComVal”).attr(“src”, select_val); }); $(“.30-34min”).click(function(){ var select_val = $(this).val(); $(“img#imgComVal”).attr(“src”, select_val); }); $(“.35-39min”).click(function(){ var select_val = $(this).val(); $(“img#imgComVal”).attr(“src”, select_val); }); $(“.40-44min”).click(function(){ var select_val = $(this).val(); $(“img#imgComVal”).attr(“src”, select_val); }); $(“.45-59min”).click(function(){ var select_val = $(this).val(); $(“img#imgComVal”).attr(“src”, select_val); }); $(“.60-89min”).click(function(){ var select_val = $(this).val(); $(“img#imgComVal”).attr(“src”, select_val); }); $(“.90upMin”).click(function(){ var select_val = $(this).val(); $(“img#imgComVal”).attr(“src”, select_val); }); });