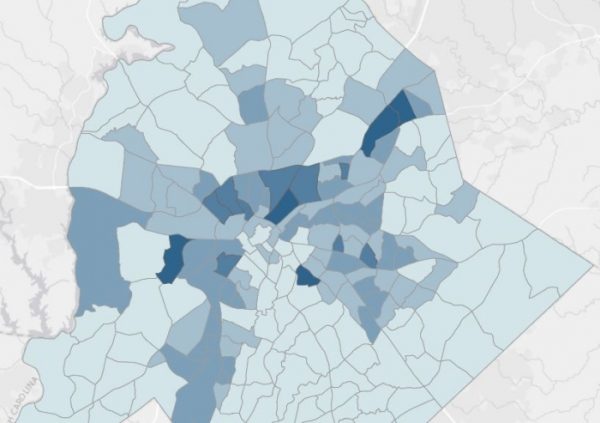
Map of Mecklenburg poverty shows familiar pattern

Because today is worldwide GIS Day, we’re highlighting a recent map from one of our researchers showing poverty rates in Mecklenburg County by census tract.
Researcher Zach Szczepaniak collected poverty data from the 2014 data in the Census Bureau’s American Community Survey – the most recent available for this level of detail.
The map shows what has been a persistent pattern for demographics in the county – a wedge of affluent neighborhoods stretching from uptown to south Charlotte and into the suburban areas nearby. The wedge is surrounded by a crescent of higher-poverty neighborhoods to the west, north and east. This pattern shows up in a number of maps, such as education levels.
To create this map, Zach Szczepaniak joined the table of numbers to a geographic boundary file (called a shapefile) that delineates Mecklenburg County census tracts using ArcMap, a GIS software program by ESRI. Once the numbers were connected to the geographic layer, he used the software to calculate the poverty rates and tweak the look of the map, adding a basemap (the grey background of rivers and roads), choosing the blue color scheme, and so on.
GIS Day celebrates geography and the many real-world applications of GIS technology. GIS (geographic information system) describes any information system that integrates, stores, analyzes, and visualizes spatial or geographic data. It’s a research tool that we often use at the UNC Charlotte Urban Institute. One notable example is the Charlotte-Mecklenburg Quality of Life Explorer, which the institute works on in partnership with Mecklenburg County and the City of Charlotte.
UNC Charlotte is celebrating GIS Day on Wednesday with a full day of activities including breakfast, geocaching, real-time balloon mapping, applied and technical GIS talks, and ending with a gathering at a bar near the campus. See the full schedule here.
And if you’re a map lover, too, please take a look at the PlanCharlotte.org collection of maps, some that we have created and others that we have seen elsewhere and want to share.