Mapping proficiency and academically gifted students

The UNC Charlotte Urban Institute is providing weekly maps and data dashboards to highlight relevant statewide education statistics for EducationNC, a nonpartisan, nonprofit news source aiming to create a bipartisan, statewide conversation about public schools. Learn more about this new initiative here.
This week’s education map lets you examine student proficiency and academically gifted students statewide, or analyzed by school district. For more about these data, scroll below the dashboard.
N.C. defines academically or intellectually gifted (AIG) students as students who perform or show the potential to perform at substantially high levels of accomplishment compared with others of their age, experiences or environment. AIG students exhibit high performance capability in intellectual areas and/or specific academic fields. These students require differentiated educational services beyond those ordinarily provided by the regular educational program.
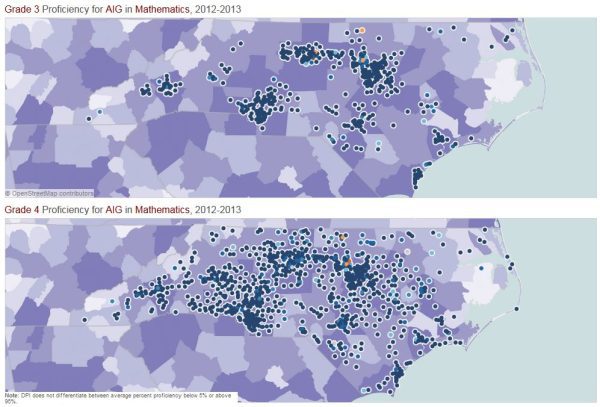
The maps provide a glance of how AIG students across the state perform in math and reading in third and fourth grades. Both third- and fourth-grade data is presented. Clusters of third-grade AIG students appear in the statewide map around larger cities including Charlotte and the Research Triangle. This may be because schools in more urbanized areas more often identify AIG students in third grade, whereas more rural districts begin to identify AIG students in fourth grade. However, this doesn’t appear to translate into significant differences in proficiency between urban and rural AIG students.
The default view of the map shows statewide AIG students proficient in math. Notice these students are generally proficient and are clustered in highly urban areas. The fourth-grade, proficient AIG students form a crest that mirrors the I-85 corridor from Charlotte to Raleigh. This is also reflects the greater urbanization and population density along this corridor. There is also a cluster of proficient AIG students along the southern coast.
Take time to explore the map options. The second tab above the maps allows you to view data on AIG students by school district on an interactive map. The data in the map are also presented in a chart for you to see how AIG students performed by school in an individual school district. Clicking on a school in any map or the chart will highlight that school’s position in the other displays, if available. If data for that district at the third or fourth-grade level is not available, those charts will become blank. Most of the state’s non-charter public schools are available, but you won’t see all schools in any given map display.
For more information on the data, click on the ‘About the Data’ tab.