Maps of High-Poverty and High-Minority Schools
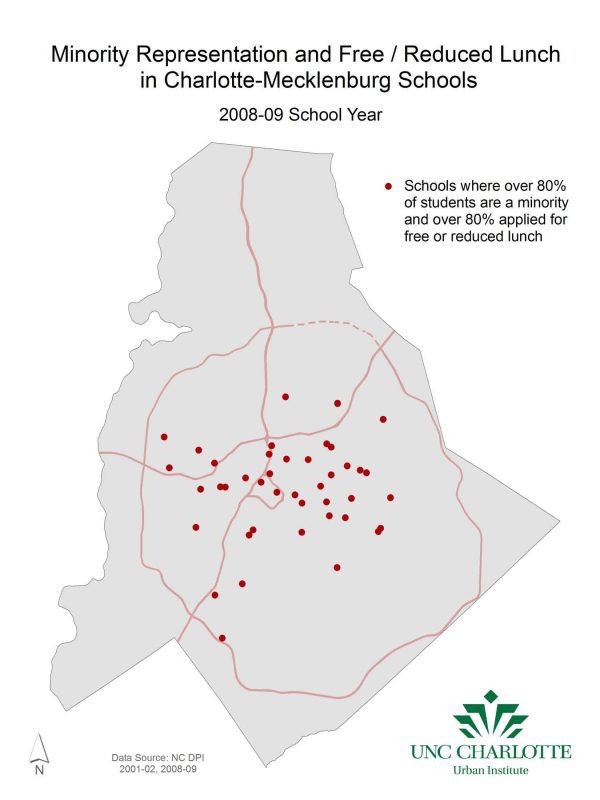
This series of maps shows the percent of students at each school in the Charlotte-Mecklenburg Schools (CMS) district that are a racial minority and the percent that applied for free/reduced lunch at two points in time, the 2001-02 and 2008-09 school years. The final two maps show only those schools in which the proportion of minority students and students receiving free/reduced lunch were both over 80%, classifying it as a high-minority, high-poverty school.
These maps were created by the UNC Charlotte Urban Institute, in collaboration with Council for Children’s Rights, to examine the impact of neighborhood school assignment on the racial and socio-economic diversity of the student bodies in the district’s schools.
The map above is just the first in this series. To see the other maps in the series, click the button below.