New homes tell the story of a growing region

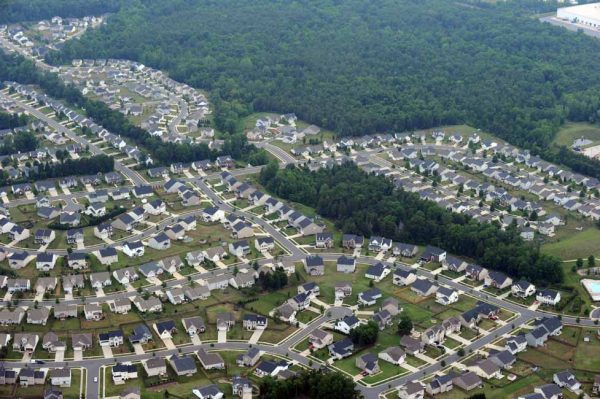
It’s no secret that the Charlotte region experienced a huge influx of new residents in recent decades. The region has consistently ranked among the nation’s fastest-growing. All those newcomers also needed homes – so new homes were built by the thousands.
The recently released American Community Survey 2007-2011 five-year estimates, reflected in the interactive map below, show just how high a percentage of the region’s housing units were built in recent years.
Use the interactive map below to explore county-level housing data for the 14-county region. (Article continues below map.)
In half the region’s 14 counties, more than 20 percent of the homes were built between 1990 and 1999 alone. Cabarrus, Iredell, Mecklenburg, Union, Lancaster and York counties also continued that 20-percent-plus growth rate into the 2000s. The survey measures all types of housing units: single-family houses, multifamily housing, owner-occupied and rental.
That means about half of all homes in the region’s most populous counties have sprung up since 1990. In some fast-growing counties, the numbers are even more dramatic. In Union County, almost a quarter of all housing was built in 2000 or after, and almost 60 percent in 1990 or later.
Some national planning experts see a potential concern with many newer houses. Mitchell Silver, recent past president of the American Planning Association and Raleigh’s top planner, said construction methods since World War II have changed. Starting from the 1980s and 1990s, he said in an interview, changes in housing codes and the rise of mass-production home-building raise questions about how well newer construction will age and whether property owners will face expensive, ongoing maintenance costs.
He said more research is needed. The question isn’t safety, he said, but, “Is this housing stock resilient compared to prewar construction?”
Understandably, home construction ranks among the top activities in North Carolina (fourth) and in the Charlotte region (14th).
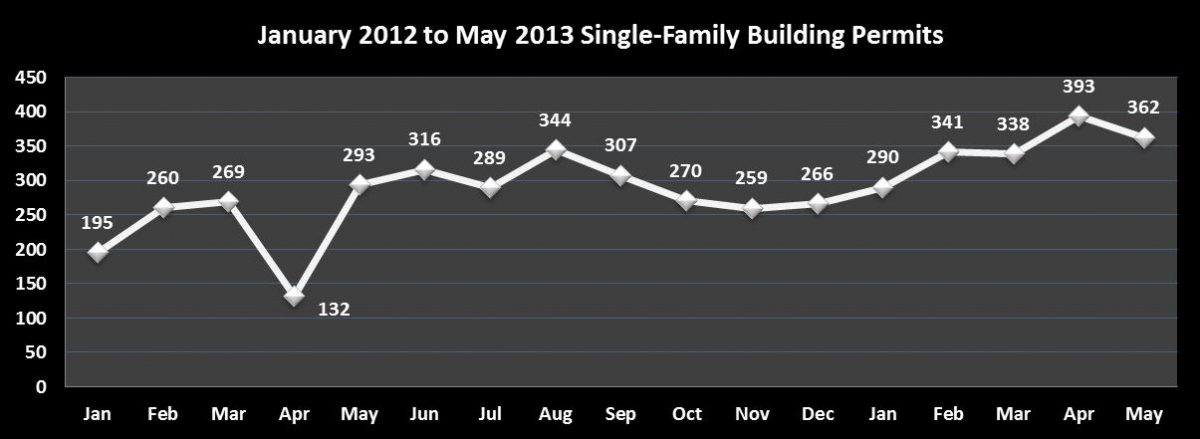
Every month, the U.S. Census Bureau tracks the number of new housing units authorized by building permits and features annual “Highlights” to put a few big things in a nutshell. As shown in the graph below, Mecklenburg’s home permitting trend has been strong in 2013.
Highlights from 2012 include a 33 percent increase over 2011 totals for new residential construction nationwide. Also listed are the top five places and regions with the largest one-year increases and decreases in housing. In the South, Mecklenburg County ranked second (behind Austin, Texas) with the largest increase – jumping from 3,094 housing units in 2011 to 8,012 in 2012. That’s an increase of 4,918 units, or 159 percent. The remaining three are also in Texas: Houston, unincorporated Harris County and Dallas.

Melissa Currie