New maps let you explore patterns of income, racial segregation and more
Where you live in Charlotte and Mecklenburg County might reflect your race, income, education level, how old you are and even how likely you are to be in an area where eligible streams are adopted for clean-up.
Newly updated maps from the Charlotte-Mecklenburg Quality of Life Explorer let you explore all these factors and more. With more than 80 maps covering demographic and socioeconomic factors, neighborhood characteristics, civic participation measures and environmental metrics, this tool is free for the community to use.
More than 30 maps have been recently updated, including those covering characteristics such as race, economic characteristics and education. (If you haven’t been to the Quality of Life Explorer in a while, look for the button marking updated maps in the bottom right of the screen to make sure you’re seeing the latest data).
All of the maps are accompanied by explanations and additional context to help residents understand our community, and can be embedded on other websites.
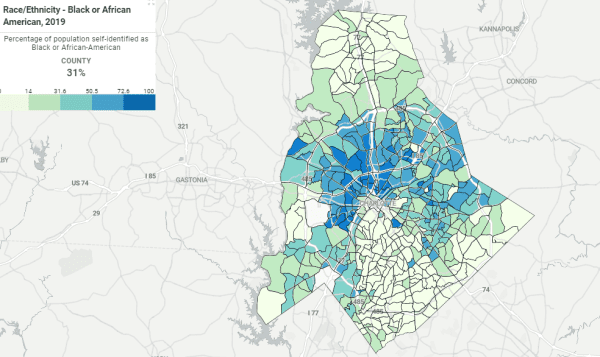
You can explore some of the updated maps below.
[Visit the Quality of Life Explorer to see all 80+ maps]
The Quality of Life Explorer is created in partnership among the City of Charlotte, Mecklenburg County and the UNC Charlotte Urban Institute, with participation from the towns of Cornelius, Davidson, Huntersville, Matthews, Mint Hill and Pineville.