Per-pupil expenditures by type, 2010-2014
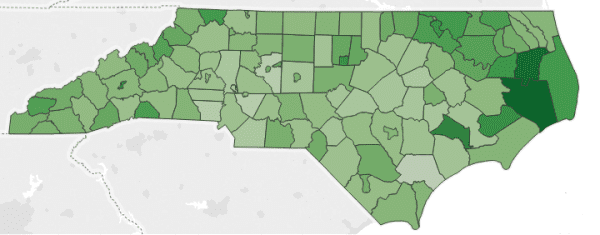
This week’s map takes a closer look at how per-pupil expenditures are spent at the district level. The types of per-pupil expenditures include employee benefits, instructional equipment, purchased services, salaries, and supplies and materials.
Hover over the map to view where per-pupil expenditures are spent and the percent of per-pupil expenditures spent in the selected category. Choose a type of expenditure displayed on the map by using the upper-right dropdown menu or by clicking on a category in the graph. Use the graph to view the expenses that use per-pupil expenditures for a school district over time. Select a district on the map or use the dropdown menu above the graph to view the district data.
A few observations about the numbers:
- Salaries accounted for more than half of the per-pupil expenditures for districts.
- Employee benefits were the second highest per-pupil expenditure for most districts.
- Districts in the northeast region of the state, near the coast, and in the mountains had higher per-pupil expenditures spent on salaries.
- Per-pupil expenditures on supplies and materials were highest in the northeast region of the state.
Note that per-pupil expenditures are for total funding, which includes federal, state and local sources. For per-pupil expenditures by funding source, look at last week’s map for additional information.
Note the scale changes for the funding sources to provide a better visual presentation of differences in per-pupil expenditures statewide.
The UNC Charlotte Urban Institute provides weekly maps and data dashboards to highlight relevant statewide education statistics for EducationNC, a nonpartisan, nonprofit news source aiming to create a bipartisan, statewide conversation about public schools. Learn more about this initiative here.
Staff