The Quality of Life Explorer: 10 years and Counting
Editor’s Note: We’re celebrating 10 years of the Charlotte-Mecklenburg Quality of Life Explorer.
By Katie Zager
The Charlotte Mecklenburg Quality of Life Explorer launched ten years ago as a collaboration between UNC Charlotte, The City of Charlotte, and Mecklenburg County. The dashboard, which can be found online at mcmap.org/qol is a neighborhood indicators project, showcasing over 80 different variables for 460 different neighborhoods in the City of Charlotte and Mecklenburg County.
When launched, the Quality of Life Explorer represented the next phase of a long-time partnership between the city and university researchers. From 2000 to 2010, the Metropolitan Studies Group at UNC Charlotte, at the request of the City of Charlotte and in cooperation with several city and county departments, published a biannual written report analyzing trends among a defined set of neighborhoods. By 2012, the Quality of Life Explorer had moved online, expanded to cover all of Mecklenburg County and quadrupled the number of variables. Where the report format relied on researchers to define ‘Quality of Life,’ the dashboard format allows users to really explore the data and determine for themselves what is important to them and their community.
The Quality of Life Explorer has variables organized around nine dimensions: Character, Economy, Education Engagement, Environment, Health, Housing, Safety, and Transportation. The dashboard has several important features that help users explore each of these dimensions.
The dashboard includes both normalized, and raw data.
Data needs to be normalized so that it can be compared across neighborhoods—otherwise the maps would just show which neighborhoods are largest. Change however, is slow, and the normalized data might miss important neighborhood developments. For example, if a neighborhood goes from 10 to 20 affordable housing units, that would still be a tiny fraction of homes, but represents a doubling of the amount of affordable housing. So allowing users to access raw data is important, too.
The dashboard also allows a user to aggregate data on different geographies on the fly.
A user can click on multiple neighborhoods at once, and the explorer will give you the value for that entire area. City Council members or County Commissioners can see what is going on in their district a whole. A teacher, familiar with their school zone, can learn more about their student’s neighborhood. Within the confines of the data, users can define for themselves what areas they are interested in.
Documenting Neighborhood Change
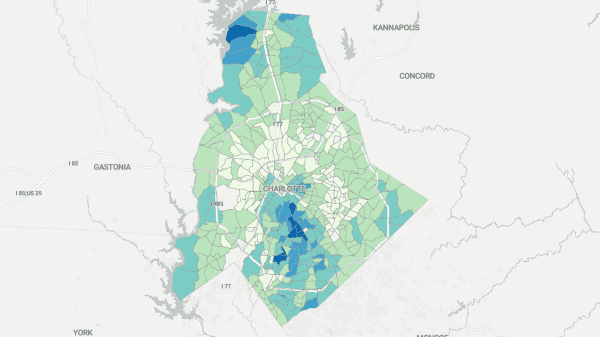
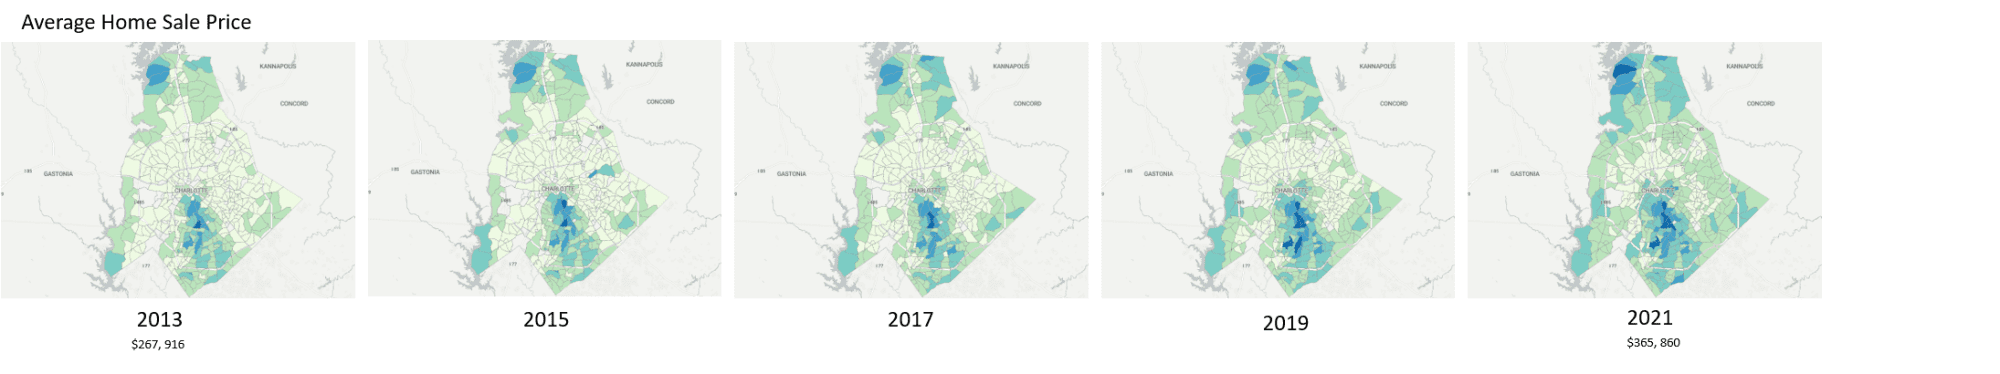
Ten years in however, the most interesting feature on the Explorer might just be the time slider. This is what allows users to see exactly how their neighborhood, or Mecklenburg County as a whole, has changed over time.
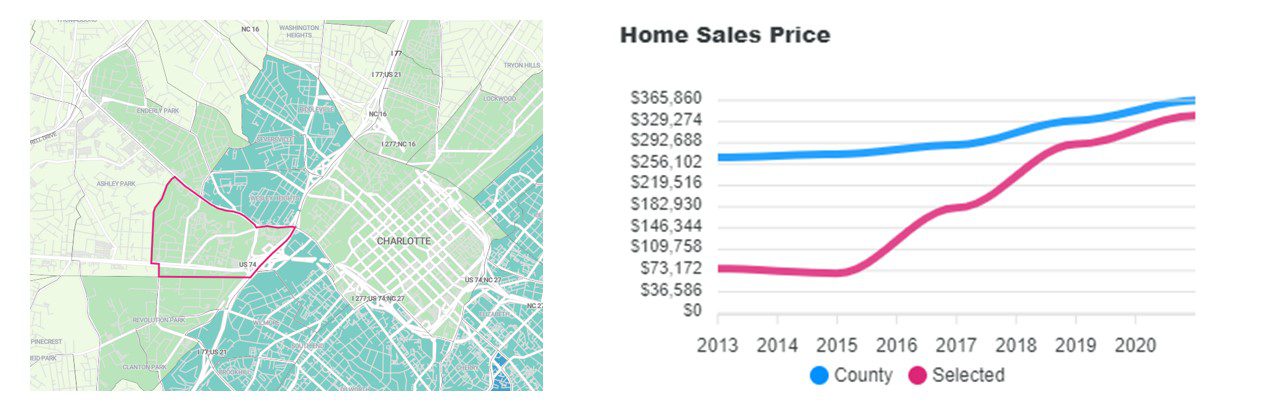
A resident in the lower part of Ashley Park however, saw their neighborhood’s average sale price almost quadruple, from $76,500 in 2013, to $365,860 in 2021.
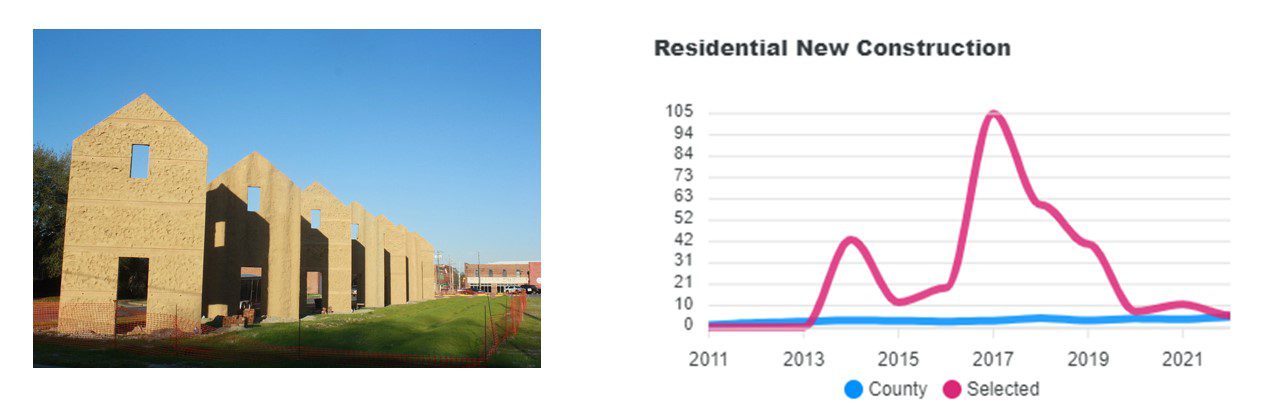
Looking at the data under the housing tab, a user can open the variable ‘Residential New Construction,’ In Ashley Park, this rapid increase in sale price was preceded by a boom in new construction. Over 1,000 new housing units (single and multi-family) were permitted between 2017 and 2019. This translates to over 40 units per acre.
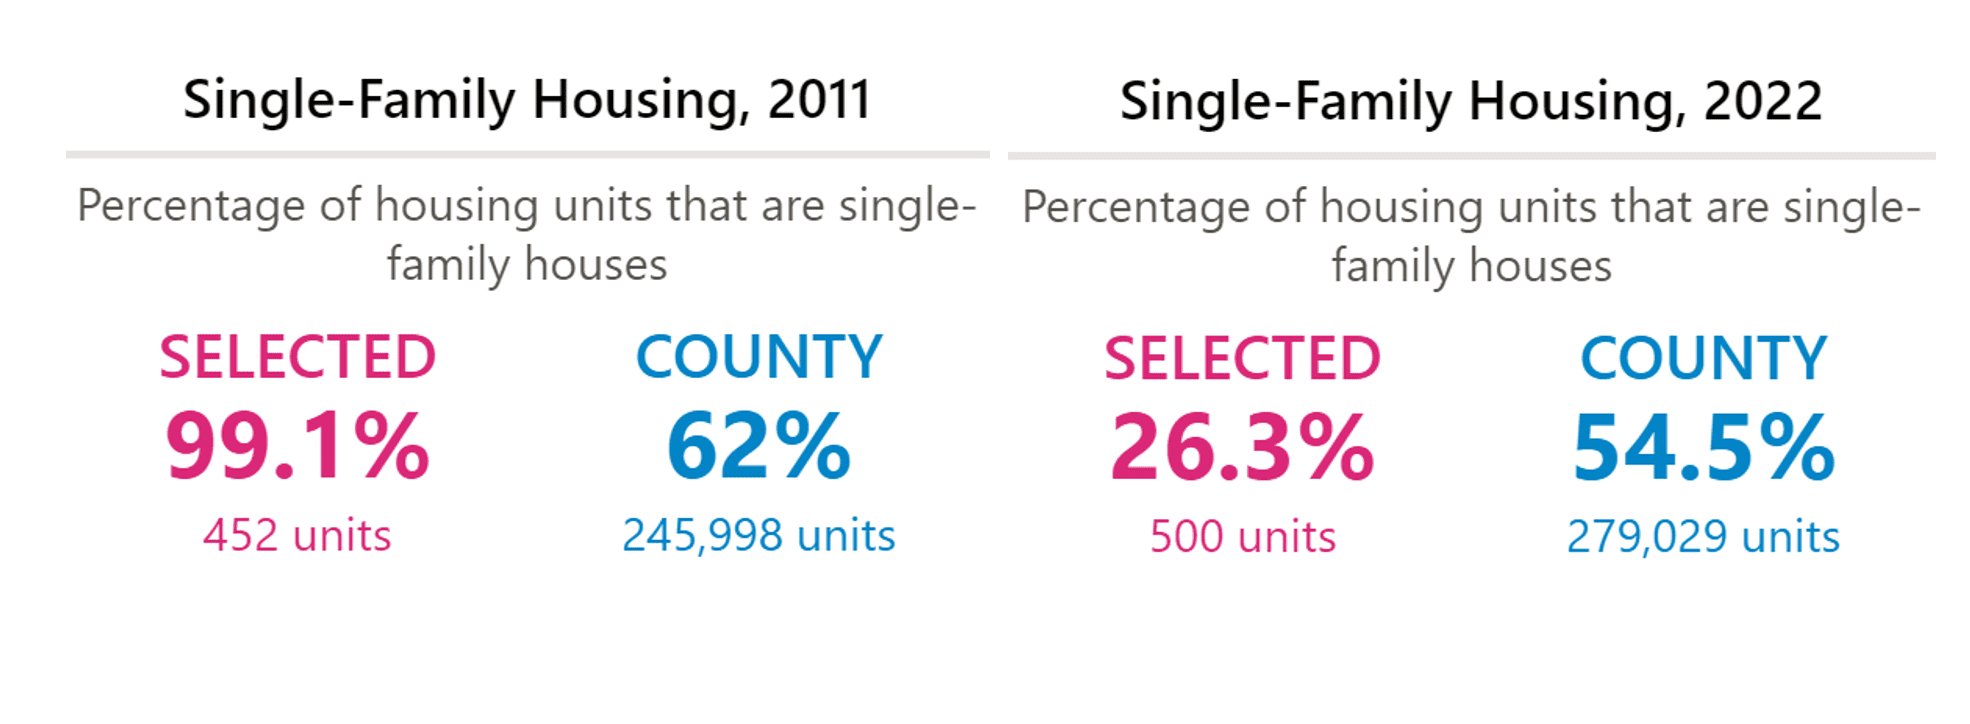
Most of these new units were multi-family, with the number of single-family units increasing from 452 to 500 units over the course of 10 years. Housing density increased from 1 unit per acre to 4.
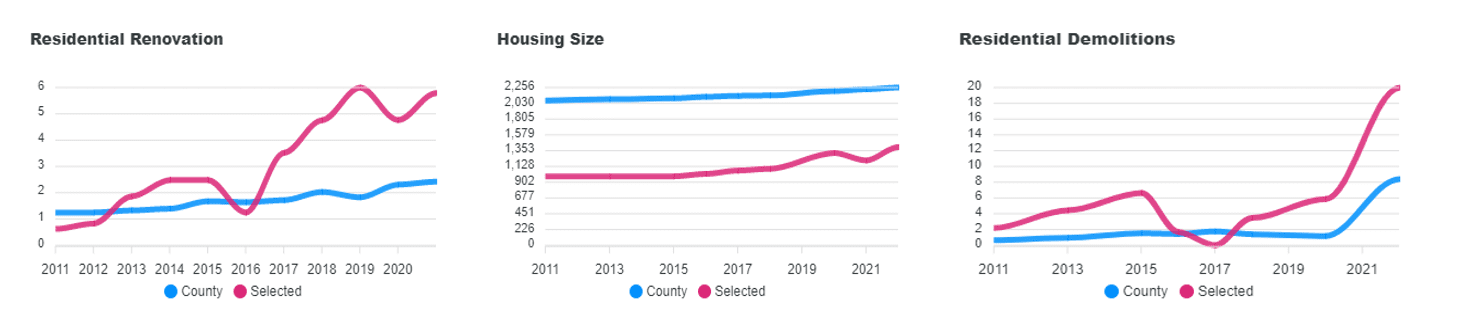
However, the data also show high levels of residential renovation between 2017 and 2019 in this neighborhood as well. People were doing things like adding space, building garages, or improving HVAC systems, which could increase property values.
Indeed, the average housing size increased by 40%, from 987 square feet in 2011 to 1,406 square feet by 2022. However, homes remain smaller than elsewhere in the county.
Finally, the data show that five years after this influx of new housing and renovation, the number of residential demolitions indicate that there is more change to come.
 A valuable tool for residents
A tool like the Quality of Life Explorer allows people to quantify what they are already seeing on the ground. If it seems like construction was everywhere for residents in this part of Ashley Park, it was. This documented construction activity also means a lot of newcomers. Additional data on the Quality of Life Explorer including demographics, education, and economics can provide more detail on how the people and businesses in the neighborhood also changed over time.
If residents or community leaders need to advocate for more resources, or work with the city to preserve affordable housing, they have the data to do that. If residents in adjacent neighborhoods want to know what to anticipate, this data can help.
All of the maps and graphs shown here are directly exportable from the Explorer, at no cost to the user and no necessary additional knowledge or tools.
A valuable tool for researchers
The Quality of Life Explorer allows users to download the data directly. Thus, the dataset itself is an important tool for researchers looking to explore different dimensions of quality of life across both time and space.
The Quality of Life Explorer is the rare dataset to publish local information at a neighborhood level, roughly equivalent to census block groups. Unlike local data imputed from larger data sets, much of the Quality of Life Explorer data is aggregated from administrative data sources. They are not estimates. While the data have limitations, the close partnership between UNC Charlotte, the Charlotte Regional DataTrust (formerly known as the Institute for Social Capital), and our local governments give users access to information that would require significant time and effort to access at a sub-county level. These variables include those from Charlotte-Mecklenburg Schools, the Mecklenburg County Health Department, and the Department of Health and Social Services.
The Quality of Life Explorer has been used by researchers at UNC Charlotte and elsewhere to study dynamics of neighborhood change, understand the impact of zoning on residential development, in evaluating place-based interventions, and in answering questions around environmental justice.
The quality and consistency of data on the Quality of Life Explorer has allowed it to become a trusted source for residents and researchers alike. The accumulation of ten years of data is the result of an enduring commitment from the University, City and County, as well as a testament to our location in such a dynamic place.
In the last 18 months, the Institute’s Quality of Life Explorer team including me, Dr. Kailas Venkitasubramanian, Nick Occhipinti, and Providence Adu have been automating the back-end of the Quality of Life Explorer. These infrastructure improvements will allow for more efficient data updates, freeing the team’s time to use the data and plan for future improvements. Kailas will discuss the improvements we’ve made and potential future work in the next edition of the Institute newsletter.