The Quality of Life Explorer: Big Value for Local Government

By Andrew Bowen, City of Charlotte
The Charlotte Mecklenburg Quality of Life Explorer is a tool that provides incredible value to our local governments, especially the City of Charlotte. At its core, it is a single location that provides consistent, reliable, and up-to-date information about the City and its neighborhoods. Whether there is a need from Economic Development to understand the features and characteristics of a corridor or a neighborhood organization looking for information and stats at their scale, the Quality of Life Explorer is built to answer questions from a range of community stakeholders.
The tool itself does not answer 100% of questions that come in from my City colleagues or the community, but it offers a great starting point. For every indicator, the detailed description and source information enables the user to learn more about what any given indicator means, what actions can change any given indicator, and where to go to learn more or take action.
The partnership between the City, the UNC Charlotte Urban Institute, and Mecklenburg County accomplished this over the last ten years with dedication to consistency and to our data partners. The Quality of Life Explorer includes curating both publicly available data through the Census Bureau as well as local data partners through the Charlotte Regional Data Trust.
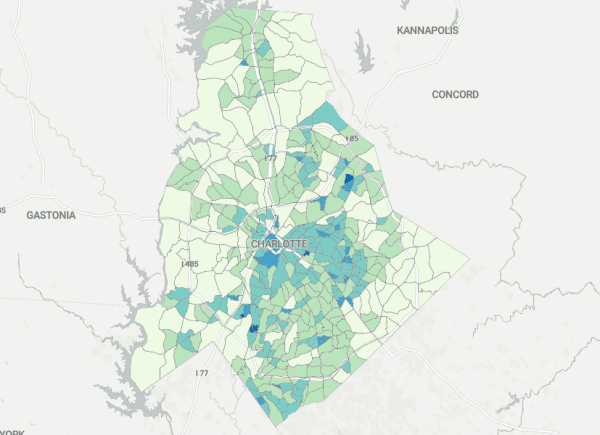
Fully leveraging the US Census Bureau’s Block Group geography, we have been able to plan for 20 years of mostly-stable neighborhood units of analysis, called Neighborhood Profile Areas (NPAs). This enables the other 30+ sources of data to be confident that there will be a reasonable ability to truly visualize change over time. Many of the data points update annually, and others every two years. In practice, this means the tool and its display of data over time is responsive to change in the data. Did your efforts to increase voter turnout work? How did a large development change the residential makeup of the neighborhood?
This tool has simplified the City’s ability to answer questions related to operations and community outcomes in given areas. Gone (mostly) are the days of sending an email to dozens of program managers and data folks asking for spreadsheets about work orders, crime rates, and housing developments; now, we can answer many questions at the click of a button. And if there are data that are missing, we have a tool and structured process to support others in feeding data to the Quality of Life Explorer to ease their reporting and see their data in a broader context. While the QOL Explorer is the finished product, much of its value is derived from the use of the NPA as a standard unit of analysis.
For the next ten years, this QOL Explorer data and the structure of NPAs will be used in multiple City initiatives. This includes:
-
the Corridors of Opportunity initiative, where each corridor has an “area of influence” that are sets of NPAs;
-
the Charlotte Future 2040 implementation goals are being tracked at the NPA level and the associated Community Area Plans are aligned with NPAs to track small-area planning efforts;
-
Staying in Place, an anti-displacement strategy, used QOL data to identify three pilot locations;
-
the Neighborhood Matching Grant program uses NPAs to structure eligibility;
-
and finally, many operations tag their efforts to the NPA to enable consistent reporting across City teams.
The Quality of Life Explorer is a unique tool that allows us to analyze and share data quickly, consistently, and collaboratively. The city has made significant investments in building a robust data ecosystem, and the Quality of Life Explorer has proven to be an enduring and foundational piece of that system. Through its use in various city initiatives, it also serves as a map for the future.
Andrew Bowen, City of Charlotte