SAT scores and participation by school, 2013-14
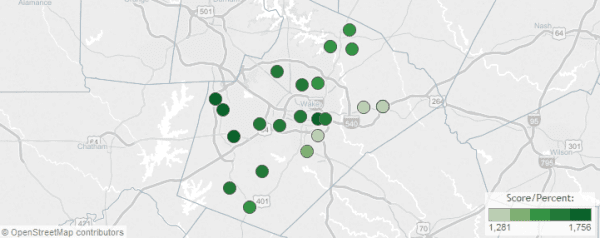
This week’s map looks at SAT scores and participation at the school level, 2013-14. Choose your district and a specific measure from the dropdown menus above the map. All the numbers are also provided in the table to the right for the schools in the district selected, as well as the district, state and national averages for comparison.
The UNC Charlotte Urban Institute provides weekly maps and data dashboards to highlight relevant statewide education statistics for EducationNC, a nonpartisan, nonprofit news source aiming to create a bipartisan, statewide conversation about public schools. Learn more about this initiative here.
Staff