SAT Scores and Partipation, 2013-4
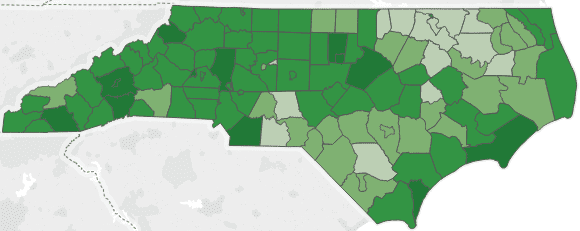
This week’s map looks at SAT scores and participation in 2013-14. The SAT exam measures the critical reading, math and writing abilities of students, providing critical measures of college readiness. Choose a test component or the percentage of students who took the SAT exam from the dropdown menu above the map. All the numbers are also provided in the table below.
A few observations about the data:
- Statewide, 64 percent of students took the SAT exam, well above the national average (52 percent).
- Ten districts had participation rates higher than the state average.
- Four districts had at least 70 percent of students take the SAT exam, while eight districts reported less than 30 percent of students taking the SAT exam.
- North Carolina students were on par with the national average in reading, but scored below the national average in math and writing.
- Chapel Hill-Carrboro City Schools’ students had the highest average score (1753) and the highest percentage of students who took the exam (81.7 percent).
- Halifax, Northampton and other northeastern N.C. districts near the Virginia border had generally lower average SAT scores, but reported higher than average rates of participation.
The UNC Charlotte Urban Institute provides weekly maps and data dashboards to highlight relevant statewide education statistics for EducationNC, a nonpartisan, nonprofit news source aiming to create a bipartisan, statewide conversation about public schools. Learn more about this initiative here.
Staff