Survey offers guidance for biking equity in Charlotte

More cycling in Charlotte is good for you, even if you never mount a bicycle. More butts on bikes means less congestion and noise on local roads, cleaner air, fewer traffic fatalities and ultimately a lighter burden on our health care system. Purchasing, operating, and maintaining a bicycle is also many times cheaper as a form of daily transportation than purchasing, operating and maintaining a personal vehicle.
Given these benefits, biking as a means of daily transportation in Charlotte remains depressingly rare. The U.S. Census estimates a paltry 0.25 percent of Charlotte residents use a bicycle as their primary means of transportation to work, compared to about 0.6 percent nationally. But before we dismiss cycling in Charlotte as a perilous novelty, a recent survey administered by the Charlotte Department of Transportation reveals a more active and dynamic bicycle community hiding behind those low census figures.
The survey, administered to 406 random Charlotte residents in June 2016, reveals that the majority of respondents (63.4 percent) would prefer to drive less and about half (50.7 percent) would prefer to bike more. The survey also asked two critical questions:
- How often do you ride a bike for “recreation or exercise”?
- How often do you ride a bike “to school, work, or for errands” – also known as utility cycling.
Data from these questions – combined with data about respondents’ income, age, race, ethnicity, gender, and other variables – reveal some important trends about who bikes, and for what purpose in Charlotte. This information ought to initiate a local conversation about how build a bicycle system that is accessible, safe, and fun for everyone.
WHO BIKES? FOR WHAT PURPOSE?
First, many more people ride bicycles in Charlotte than the census reveals. One third (33.2 percent) of all respondents to the CDOT survey reported riding their bicycle for some purpose at least once a week.
 Survey data from the Charlotte Department of Transportation show that almost all utility cyclists – those who ride to school, work or for errands – in Charlotte also ride for recreation at least once a week. Chart: Robert Boyer
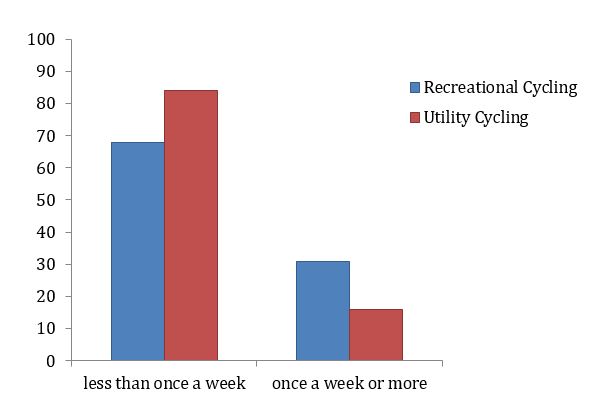
Unsurprisingly, twice as many respondents ride a bike once a week for recreation rather than for utility purposes – 32 percent versus 14 percent, respectively – and nearly all utility riders are also recreational riders (see diagram above). Why? You can ride a bicycle for recreation in more places, at more times, and with generally fewer restrictions than riding for utility, which typically involves a specific destination and time constraints. If you decide to ride to work, for example, you probably have to arrive at a specific time, in specific attire, and you may or may not have access to changing facilities, showers and proper storage. Riding for recreation also allow us to choose the routes we find most comfortable, whether or not that involves structured bike lanes or greenways. All these factors make utility cycling more complicated to adopt if your day-to-day routine already revolves around the automobile.
 Weekly recreational cycling (blue) vs. weekly utility cycling (red). Chart: Robert Boyer, from Charlotte Department of Transportation data
Dig a little deeper, and the data reveal interesting details related to age, gender, income, race, ethnicity, location and households with children. (A note for fellow data nerds: All reported figures below are statistically significant differences, with a p-value of 0.05 or less.)
- Men ride more than women, for all purposes. 40 percent of men ride weekly for recreation compared to about 25 percent of women. For utility purposes, it’s 20 percent for men vs. 12.2 percent women.
- Older respondents ride less for recreation. Only 14.7 percent of residents over age 65 ride once a week for recreation, compared to 31.8 percent overall.
- Respondents with children in the household ride more for recreation: 43 percent of respondents with children at home ride weekly for recreation, compared to about 29 percent of respondents without children in the household.
- Wealthy respondents ride more for recreation. Almost half (49 percent) of individuals with an annual household income of $100,000 or higher ride weekly for recreation, but only 16.5 percent of individuals in the $25,000-or-lower bracket ride weekly.
- Black/African American respondents ride less for recreation than non-black/African American respondents. While utility cycling among black respondents is statistically on par with other race groups, 21.3 percent of black respondents ride for recreation versus 31.2 percent overall.
- Latino respondents ride more for utility. 31.1 percent of Latino respondents ride once a week or more for utility, compared to 14.9 percent of non-Latino respondents.
- Residents who live in the center of the city ride less for recreation than residents on the spatial fringe. Nearly 36 percent of residents living outside Charlotte Route 4 (the “inner loop” made up of Woodlawn-Runnymede-Wendover and Eastway) ride once a week or more for recreation, compared to 24.9 percent inside Route 4.
When these different variables are isolated statistically from one another, it is possible to understand the effects that each has on the odds of an individual cycling for different purposes. So, it appears as though the variables that predict recreational cycling most reliably are gender, income, and race. All other things equal, the odds of recreational cycling are higher among higher-income respondents and male respondents, while the odds are lower among black/African American respondents. The strongest predictor, by far, that someone will cycle for utility is whether that person cycles for recreation, lending some evidence to the story that recreational cycling serves as a “gateway” to utility cycling. It also appears Latino residents are more likely to ride for utility, and that the odds of utility cycling increases in neighborhoods with more bike lanes, signed routes, and greenways per square mile of land.
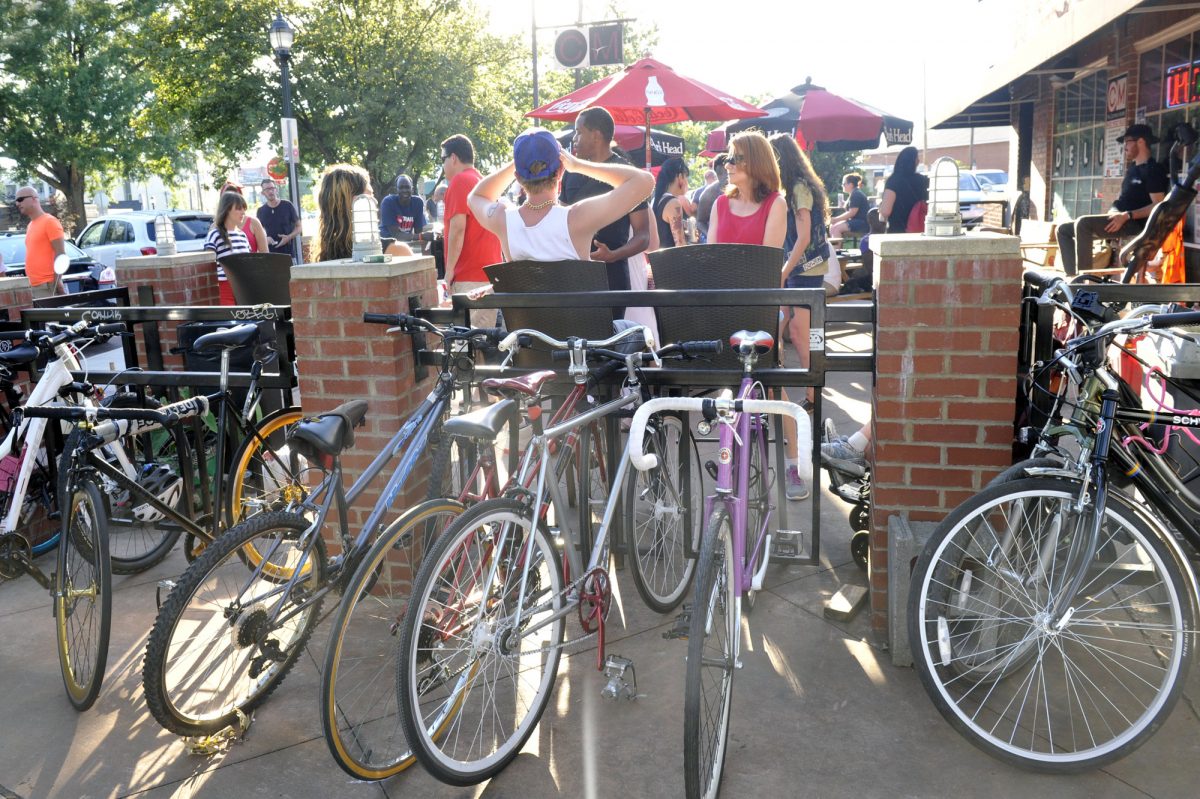
 Can recreational cycling be a “gateway” for cycling for work, to school or to run errands? Photo: Nancy Pierce
WHAT DOES THIS MEAN FOR BICYCLE PLANNING IN CHARLOTTE?
In the past 15 years, bicycle planning in the City of Charlotte has accelerated from a virtual standing start. What began as a single mile of bike lane in 2003 has radiated to a 190-mile network of bike lanes, signed routes and greenways. The city and other local sponsors host regular promotional events like Bike Week, the Mayor’s Bike Ride and Open Streets 704, and recreational cyclists can participate in dozens of “social rides” matching their particular interests and abilities any night of the week.
Staff at the Charlotte Department of Transportation have recently begun circulating a draft of the city’s next bicycle plan, Charlotte BIKES, which prioritizes “equity” among other values. The plan opens with an ambitious vision statement:
Charlotte will offer an inclusive cycling environment where people of all ages and abilities can use their bikes for transportation, fitness, and fun. The City will work to extend bicycle infrastructure, educational opportunities, and promotional events to all neighborhoods and households striving for equitable, affordable mobility options that improve city-wide public health, support the local economy, and reduce automobile dependency in the Queen City [emphasis mine].
The data discussed above offer the city a benchmark to determine what “inclusive” and “equitable” cycling means. For example, the city may want to begin its next steps of bicycle planning by asking, “How can plans for bicycle infrastructure, education, law enforcement, and promotional events both maintain levels of service for existing bikers and extend opportunities for underrepresented groups of cyclists?
Addressing these inequities may require deeper inquiry. For example: Why do men bike more than women? Why do low-income residents bike less for recreation than their wealthy fellow residents.? Why do black residents bike less than non-black residents? And if biking for recreation is a gateway to utility cycling – as the statistics imply – then what can the city do to extend more recreational opportunities to low-income groups, women, and black residents who cycle less for recreation than others?
Research in urban planning and transportation engineering shows that “high-cycling” countries like Denmark, the Netherlands and Germany have cycling populations that more closely mirror the characteristics of the general population than “low-cycling” countries like the U.S., Canada, and the United Kingdom. In the Netherlands, for example, women and older residents ride bikes as much as, and sometimes more than, their young, male compatriots. Presumably, this is because riding a bicycle in “high-cycling” countries is not a niche activity, but accessible to all and embedded in day-to-day routines of the entire population. It appears, then, that bicycle system equity and broad bicycle system growth go hand-in-hand: increasing the general population of cyclists (and all accompanying environmental benefits) will require investments in programs and infrastructure that make cycling easy and fun for people of diverse genders, ages, races and incomes. CDOT now has the data to begin, with support from the City Council, addressing these inequities in a systematic and incisive way.
Robert Boyer is an assistant professor in the UNC Charlotte Department of Geography & Earth Sciences where he teaches urban and regional planning, environmental planning and urban sustainability. He is a member of the City of Charlotte’s Bicycle Advisory Committee.
Opinions in this article are those of the author and not necessarily those of the UNC Charlotte Urban Institute or the University of North Carolina at Charlotte.
Robert Boyer