Voters born elsewhere make up nearly half of N.C. electorate

One hundred years ago, when North Carolina had a population of about 2.5 million people, more than nine out of 10 residents were native Tar Heels. Today’s North Carolina, in contrast, approaches a population of 10 million, with more than 4 million residents born in another state or country.
Population growth and change have had a dramatic effect on the state’s electorate. The 2012 presidential election exit poll found that barely half of the state’s voters were native North Carolinians. Forty-eight percent of people who cast ballots in North Carolina were born elsewhere.
Read moreThis article appeared in the UNC Program on Public Life’s publication DataNet (July 2014). Click here to see the full document with graphics on the top 15 counties in in-migrant voters as well as other information on this topic. |
The UNC Program on Public Life continues its exploration of the demographic and electoral trends that have positioned North Carolina as one of the nation’s swing states. At our request, the State Board of Elections provided us with 274,000 records showing newly registered voters who had entered an out-of-state address as their previous residence on their registration forms. The board’s staff recommended that we focus on the period from 2004 to 2012 because of the reliability of the data. So, while this report is not a comprehensive analysis of in-migrant voters, we can offer a look at the flow of voters from other states into each North Carolina county.
Our findings come in two formats: 1) The July 2014 issue of DataNet (see link in “Read More” above), which contains charts on the top 15 counties in in-migrant voters, as well as a historical summary of native/nonnative population produced by Rebecca Tippett of Carolina Demography; 2) Our website, www.southnow.org, offers an interactive graphic that gives a county-by-county count of the previous states of residence of in-migrant voters. In addition, the website also contains a series of interviews with recently arrived voters, conducted by students in Guillory’s public affairs reporting class in the UNC School of Journalism and Mass Communication.
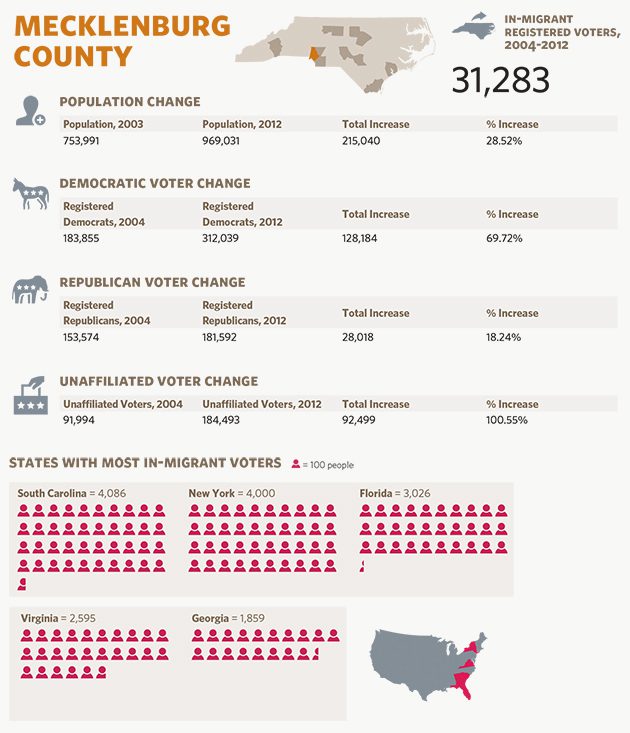
In reading the chart below of Mecklenburg County, keep in mind that in-migrant voters (meaning people who move here from another state) constitute only one factor in shifts in voter registration. Shifts also result from people moving freely from one community to another within the state, and changing their voter registration. Here, then, are key findings:
- The five counties with the highest number of in-migrant voters in the 2004–2012 period: Mecklenburg, Wake, Durham, Buncombe and Cumberland. The other 10 counties represent a mixture of major urban centers (Guilford and Forsyth), coastal counties (Onslow and New Hanover), recreational and retirement meccas (Moore and Brunswick), and suburban-style communities near major cities (Cabarrus, Union, Orange and Henderson).
- The five states accounting for the most exported voters to North Carolina, in this order: Florida, Virginia, New York, South Carolina, Georgia. Pennsylvania, Maryland and California also show up among top states delivering in-migrants to North Carolina’s growth counties.
- While the data, as provided by the state Board of Election, do not show precisely how many in-migrants registered as Democrats, Republicans and unaffiliated voters, they clearly have contributed to a surge in new voters deciding not to affiliate with a major political party. Mecklenburg and Wake, along with four other counties, had gains in unaffiliated voters of 100 percent or higher.
- Growth in Democratic voter registration out-paced Republican registration growth in Mecklenburg, Wake, Durham, Buncombe, Cumberland, Guilford, Orange and Forsyth. Republican registration increased more than Democratic registration in Onslow, Union, Cabarrus and Brunswick. Republican registration dropped in Durham. While the Democratic gains came mostly in metropolitan counties, Republicans saw registration gains in less-populous counties, such as Hoke, Camden, Pender, Gates, Currituck, Granville, Jones and Tyrrell.
In the years explored in this report, the state’s population grew by 16 percent. The Great Recession dampened, but did not stop, in-migration. Statewide Democratic registration rose by 20 percent, Republican by 18.5 percent and unaffiliated by 93 percent.
On Election Day, most unaffiliated voters actually perform as either Democrats or Republicans, casting their votes largely for candidates of the major parties, though with a relatively modest, yet significant share of ticket-splitters.
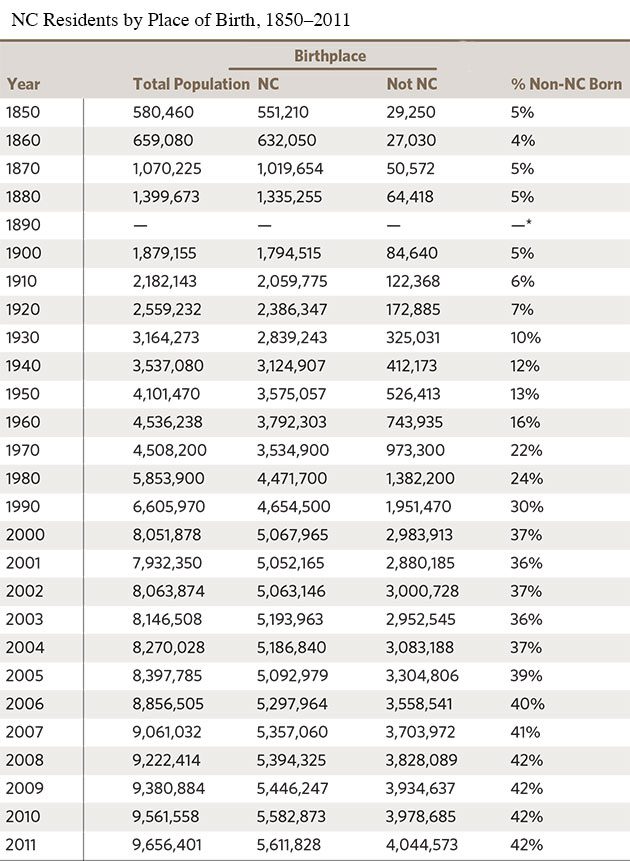
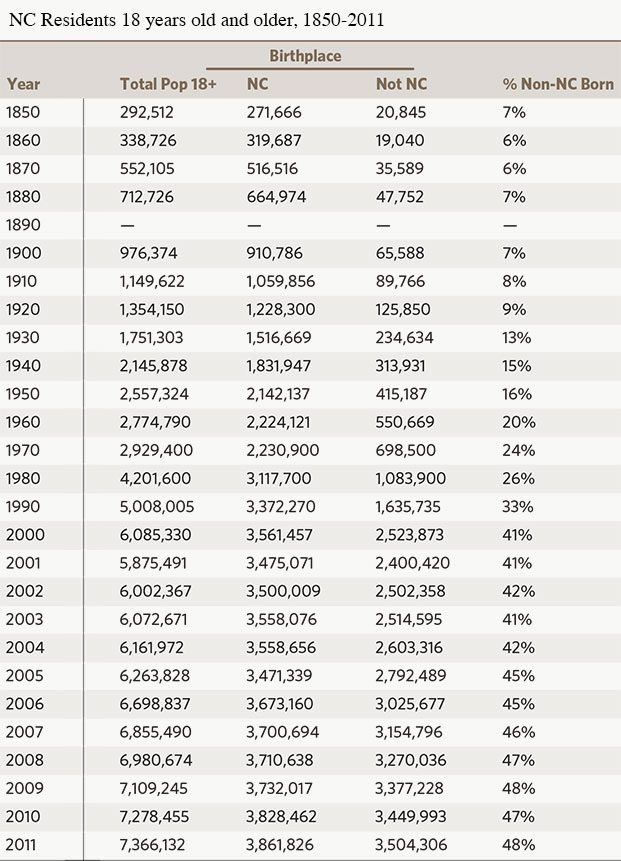
The chart below shows North Carolina residents by place of birth from 1850 to 2011. Scroll down to see the 18-year-old and older population for the same range of years. The second table shows that in recent years, voting-aged people not native to the state make up 48 percent of the population.

Source for this table and the table below: Data from 1850–2000 are from the decennial census. Data from 2001–2011 are from the American Community Survey. All data were drawn from the University of Minnesota’s Integrated Public Use Microdata Sample and analyzed by Carolina Demography.
* Data not available

