Understanding corporate landlords: Where are they in Mecklenburg County?

This article is the third in an informational series about corporate landlords. Click here to read the first article, “Understanding corporate landlords: Decoding a recent housing phenomenon,” and click here to read the second article, “Understanding corporate landlords: Who are they?”
Over the past year, we’ve taken a close look at corporate landlords and their ownership of single-family homes in Mecklenburg County. We began by examining how the terms “corporation” and “investor” are often applied to entities with vastly different portfolios, ranging from three to 1,000 properties, before delving deeper into the issue of linking corporations to their various subsidiaries. Using data and processes outlined in sources ranging from The Washington Post to the North Carolina Secretary of State and previous work by the Institute, we developed a replicable process that identified approximately 145 corporate investors owning at least 15 single-family homes in Mecklenburg County.
This comes out to just under 7.5% of all single-family homes at the end of 2023. Yet, you may still be wondering:
- How has the presence of corporate landlords changed over time?
- Where are corporate-owned single-family homes located in Mecklenburg County? Are they clustered in particular neighborhoods?
- Given their small share of single-family homes, are corporate landlords relevant in larger conversations about housing affordability and access?
The Changing Landscape of Corporate Home Ownership
While research continues to show that corporate ownership remains only a fraction of single-family homes, its hold in the market is expanding. An analysis by the Federal Reserve Bank of Richmond shows evidence that the share of single-family homes purchased by investors rose by over 5 percent during the pandemic in DC, (West) Virginia, South Carolina, North Carolina, and Maryland before decreasing in 2023 and 2024. Looking at the most recent data from CoreLogic, Seymour et al. find that the highest concentrations of institutional investment are found primarily in metro areas in the Sunbelt, including Atlanta, Dallas, Phoenix, Miami, and Charlotte.
Figure 1 plots the share of investor-owned single-family homes in Mecklenburg County for 2019 and 2023. Small investors (those entities that own fewer than three properties) maintained a relatively consistent share of the single-family home market, increasing by only 0.3% over the past four years. A similar conclusion is found for both medium (3-9 properties) and large (between 10 and 14 properties) investors, with their share remaining under 1 percent in both years. It is only the corporate investor portion (those who own a minimum of 15 properties) that sees a significant increase in this time.
Figure 1: Corporate investors increased their share of single-family properties by nearly 70% between 2019 and 2023 in Mecklenburg County.
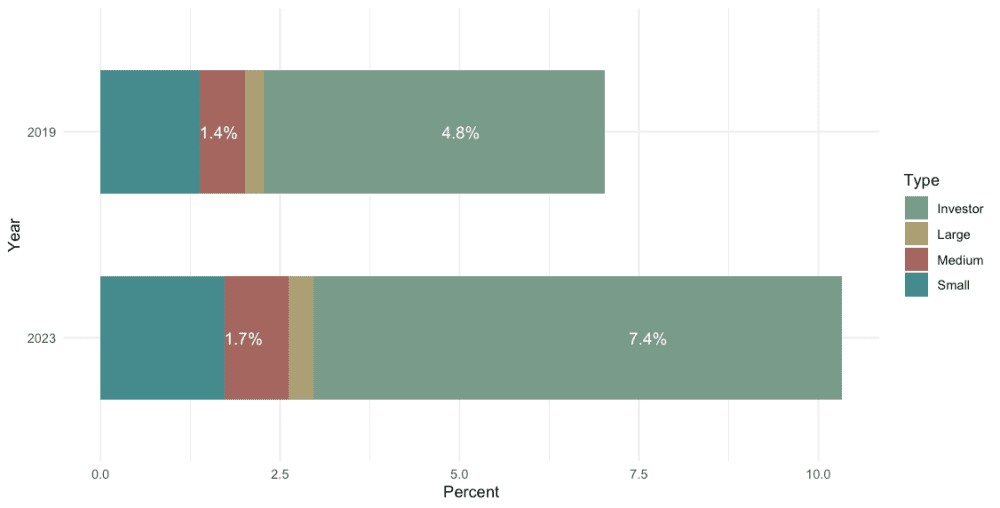
At the end of 2019, corporate investors owned just under 5% of all single-family properties in Mecklenburg County. This comes out to just over 12,000 homes. Four years later, their share of single-family homes increased to just under 7.5%, or just under 20,000 homes. This translates to a 65% increase in market share.
The Geography of Corporate-Owned Single-Family Homes
As corporate ownership expands, it is doing so in a relatively limited number of neighborhoods. To determine the number of corporate-owned single-family homes at the neighborhood level, we examine the 2019 and 2023 Tax Year parcel data highlighted in previous articles and connect it to the most recent Neighborhood Profile Area, or NPA, data provided by the Quality of Life Explorer in Figure 2. While Figure 1 demonstrated that the number of corporate-owned housing units expanded at the county level, Figure 2 indicates that the proportion of single-family homes within the respective NPAs also grew.
Figure 2: Corporate investors owned at least 15% of all single-family properties in approximately 13% of all neighborhoods (58 total) in 2023
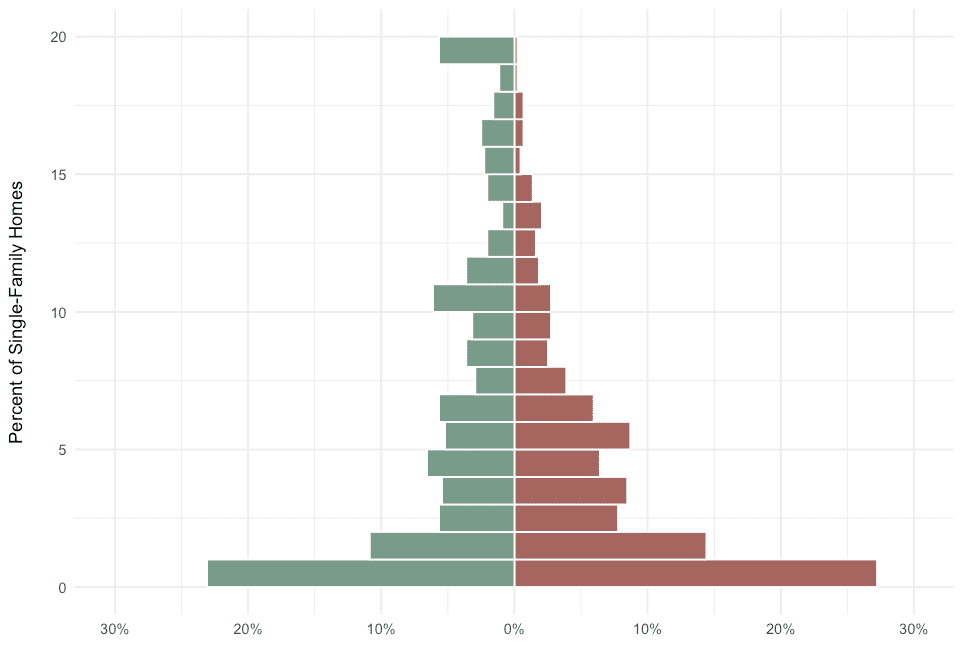
In 2019, 45% of eligible NPAs (those with at least 10 single-family homes) had what would be considered low investment, i.e., less than 2.5% of all single-family homes in the neighborhood were owned by an investor. This drops to just over 35% of NPAs at the end of 2023.
The real point of interest, however, is the neighborhoods experiencing high levels of investment. These would be areas where an investor owns at least 15% of all single-family homes. In 2019, less than 3% (10) of NPAs experienced high levels of investment, while over 13% of NPAs (58) in 2023 experienced similar levels of investment. While it is essential to understand how investment has changed overall in Mecklenburg County, neighborhoods with higher concentrations of corporate owners are more revealing when we want to understand how corporate ownership is impacting key segments of the housing market, such as affordable housing.
Figure 3: Corporate ownership of single-family homes remained concentrated in similar areas before and after the Pandemic
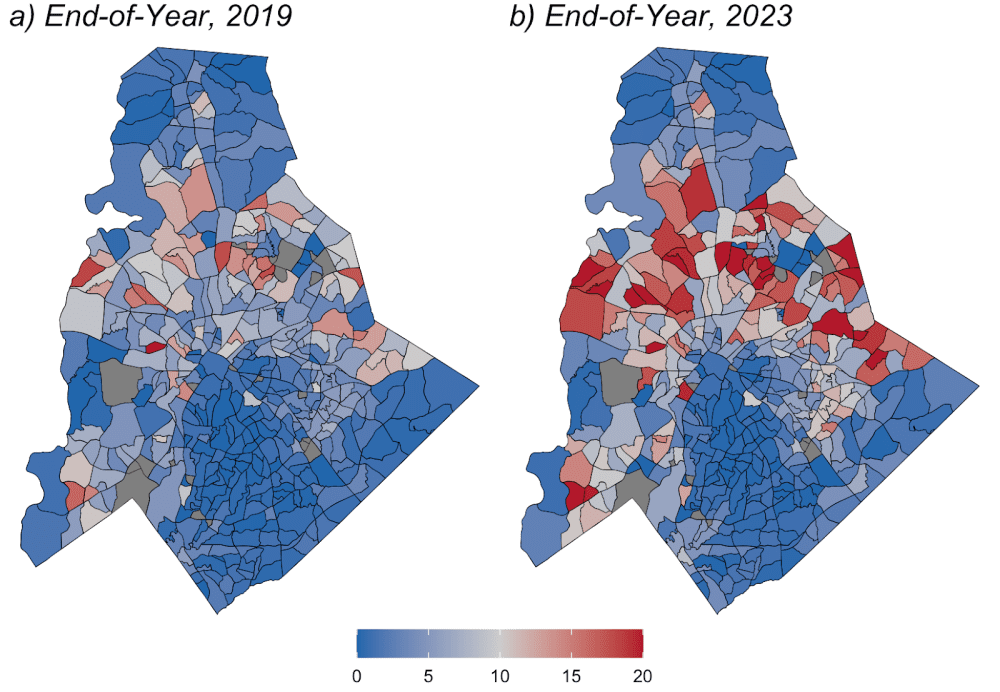
Figure 3 also illustrates that as the proportion of corporate-owned single-family homes has increased between this time period, they have stayed mainly concentrated in similar locations. Neighborhoods considered to be in the Wedge of the County, including Quail Hollow, South Park, Barclays Down, and Myers Park, experience extremely low levels of corporate ownership of their single-family homes. Neighborhoods with high concentrations (at least 20 percent of single-family homes) of corporate ownership are found in the Northwest (Coulwood and Oakdale), Northeast (University City), and Southwest (Steele Creek) quadrants of Charlotte, as well as in a few neighborhoods in the Huntersville area. While understanding where corporate ownership appears to be concentrated, this represents only an initial step in our analysis.
Why go beyond simple counts? A neighborhood with a lot of investor‑owned homes might be a one‑off outlier—or it could sit inside a broader pocket of similar activity that spills across nearby areas. Put another way, a neighborhood with a higher proportion of investor-owned dwellings could be an isolated case or part of a larger trend in nearby areas. Hot spot analysis enables us to test this by evaluating whether high or low values cluster together more frequently than would be expected by chance. This multi-step method highlights true hot and cold spots rather than isolated extremes.
First, we asked if concentrations of corporate owners tend to sit near each other more than chance would allow. We employ specific methods that enable us to determine if corporate-owned single-family homes cluster together overall and to identify whether there is a concentration of high and low values. These methods provided evidence of countywide clustering, indicating that the map in Figure 3 is not random noise and gave us the green light—and added protection against false positives—to proceed with local hot-and cold-spot mapping.
Hot- and cold-spot mapping enables us to pinpoint exactly where those clusters are the strongest (see footnote for a detailed walkthrough of the process). Figure 4 illustrates neighborhoods that experience statistically significant spatial clusters of high corporate ownership (dark red) in addition to those with significantly low clusters (dark blue). The grey areas are neighborhoods where the clustering of corporate-owned SFH is determined to be insignificant. At the same time, the lighter shades of red/blue imply that clustering is a noticeable issue, though significance is relatively weak.
Figure 4: Select neighborhoods in the Southwest corner of Charlotte experience significantly high clusters of SFHs owned by corporate investors
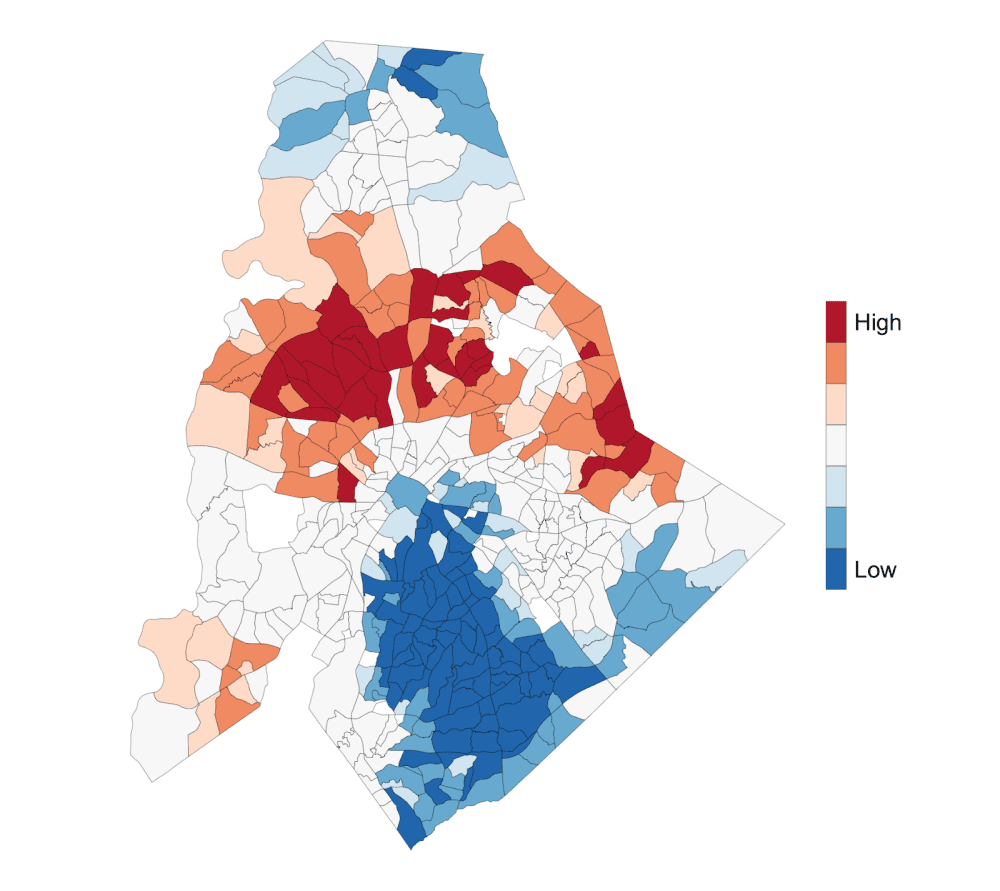
Figure 4 shows that while neighborhoods with a high (low) proportion of corporate ownership can also experience statistically significant levels of clustering, this is not inevitably the case. This again emphasizes the importance of employing methodological rigor to identify statistically significant clusters of high or low values, rather than relying solely on the distribution of ownership to discern general patterns and densities.
Why Does Understanding the Details of Corporate Ownership Matter?
Throughout this series, we were able to:
- Define and group corporate landlords separately from other, smaller, investors,
- Illustrate that this group of investors has become more prevalent in Mecklenburg County since 2019, and
- Corporate ownership of single-family properties is clustered in identifiable neighborhoods (NPAs).
This could still lead the reader to question the importance and/or implications of this work. Why does it matter if we can separate corporate investors from other types of firms or individuals? Why does it matter if we know they are concentrated in particular neighborhoods?
There is a practical aspect for consumers, specifically homebuyers with more modest incomes, as the increasing share of real estate investors in the market can significantly shift bargaining power due to their more substantial financial resources. A recent survey conducted by JW Surety Bond finds that 93% of Americans believe that corporate ownership of homes is making homeownership less accessible, and one-third of respondents claim to have given up on homeownership because of corporate buyers outbidding individuals. This assumption receives some support in the literature, with studies finding that higher concentrations of corporate-owned housing can lead to higher home prices or stagnant homeownership rates.
Speaking to the academic research, there has been a notable increase in interest over the past decade regarding the impact of corporate landlords on various outcomes, including home values, eviction rates, and code violations. It should be pointed out, however, that conducting analyses in this area poses challenges due to the absence of a widely accepted and generalizable definition of what constitutes a corporate investor at the metropolitan, county, or neighborhood level, though there has been recent progress in this area (see Hangen & O’Brien (2025) for a synopsis on the current state of the literature). This lack of clarity can lead to unfounded conclusions regarding the impact of corporate landlords. Having a replicable methodology and finding evidence that supports larger trends nationwide, however, presents a starting point where researchers can more confidently ask questions regarding causality and whether corporate-owned housing has a significant impact on these issues.
Corporate landlords also remain a frequent topic of discussion among policymakers. Over the past few years, legislatures have introduced policies revolving around corporate landlords, including limiting/placing a surcharge on investor purchases of SFHs, expanding tenant protections, and giving residents increased purchasing power. Although many of these policies have not been passed or enacted on a significant scale, it is crucial to establish a standardized system for linking corporate landlords to their subsidiaries, ensuring that these policies focus on the correct entities and that smaller-scale investors are not negatively impacted.
In conclusion, this series represents a necessary, initial step in understanding corporate ownership of single-family homes. Determining where corporate ownership is concentrated at the local level allows us to more accurately address questions that researchers have only begun to answer, including issues surrounding housing affordability and homeownership, neighborhood stability, and monopolization risks in the housing market. While existing research suggests a correlation between these relationships, this approach now provides the opportunity for more granular and detailed analyses to unpack the impact of corporate home ownership.
____________________________________
1 Stoney, Sierra. 2024. “District Digest: The Roles of Single-Family Housing Investors, Big and Small, in the Fifth District.” Econ Focus 24 (4Q): 26–30.
2 Seymour, Eric, Taylor Shelton, Stephen Averill Sherman, and Joshua Akers. 2025. “The Metropolitan and Neighborhood Geographies of REIT- and Private Equity–Owned Single-Family Rentals.” Journal of Urban Affairs 47 (6): 1998–2022. https://doi.org/10.1080/07352166.2023.2276766.
3 The City of Charlotte states how the “wedge” denotes a spatial pattern of neighborhoods (NPAs) in Uptown, city center, and southwest Charlotte with a high contraction of White residents (percentage), family income, and voter participation.
4 The first step in conducting a hotspot analysis is to compare the actual pattern/distribution of corporate-owned single-family homes in and around each neighborhood to a hypothetical alternative by calculating a local Getis–Ord statistic for each NPA. These neighborhood weights are then used to run a set number of simulations (we used 500) to test whether the location of corporate owned housing is unusually low or high.
5 Eric Weisbrot. (2025, March 27). The Corporate Landlord Effect: America’s Shrinking Dream of Homeownership. JW Surety Bonds. https://www.jwsuretybonds.com/blog/the-corporate-landlord-effect
6 Garriga, C., Gete, P., & Tsouderou, A. (2023). The economic effects of real estate investors. Real Estate Economics, 51(3), 655–685. https://doi.org/10.1111/1540-6229.12427
7 Raymond, E. L., Duckworth, R., Miller, B., Lucas, M., & Pokharel, S. (2018). From Foreclosure to Eviction: Housing Insecurity in Corporate-Owned Single-Family Rentals. Cityscape, 20(3), 159–188.
8 Seymour, E., Shelton, T., Sherman, S. A., & Akers, J. (2025). The metropolitan and neighborhood geographies of REIT- and private equity–owned single-family rentals. Journal of Urban Affairs, 47(6), 1998–2022. https://doi.org/10.1080/07352166.2023.2276766
9 Home Purchase; Corporate Buyer Restriction, HB 2360, Arizona House (2025); Home Ownership Market Manipulation, S 199, North Carolina Senate (2025); VA Code. § 15.2-2223.5 (2021); Affordable Housing, HB 1089, Florida Senate (2022).