Making the invisible visible: Strengthening your logic model with ‘intangibles’

Inspired by Travis Mayo’s IDEA webinar [Watch now on YouTube]
Within the nonprofit and civil service sector, it’s not uncommon to approach social impact reporting the way we approach math: add up the money, the person power, the activities delivered and expect to get to outcomes. In reality, it’s not usually that simple. What makes or breaks social impact isn’t simply an equation, however, it’s also the human elements.
Things like love, hope, trust and agency–concepts we’re calling “intangibles” because they can’t be easily held in our hands or counted–are often the secret sauce to delivering successful programs and to telling a powerful impact story. And yet, intangibles are so often dismissed as “just feelings” that are too difficult to measure. As a result, most standard logic models, like the housing program example shown below in Figure 1, operate on the assumption that people + programs = outcomes.
Figure 1. Traditional Logic Model Example
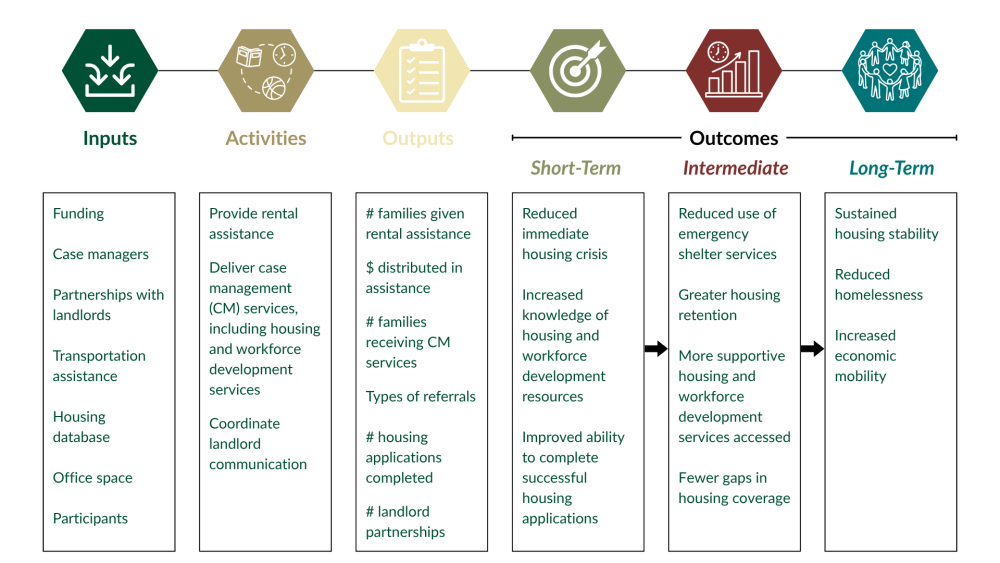
Note. Image adapted from IDEA Webinar
Logic models reflect the way we think about important program elements and how they lead to impact, and too often our humanness is missing from them. Because of that, our data, measures, and impact storytelling may lose sight of the very communities that we intend to serve. What can we do to resist this tendency? How can we create human-centered logic models?
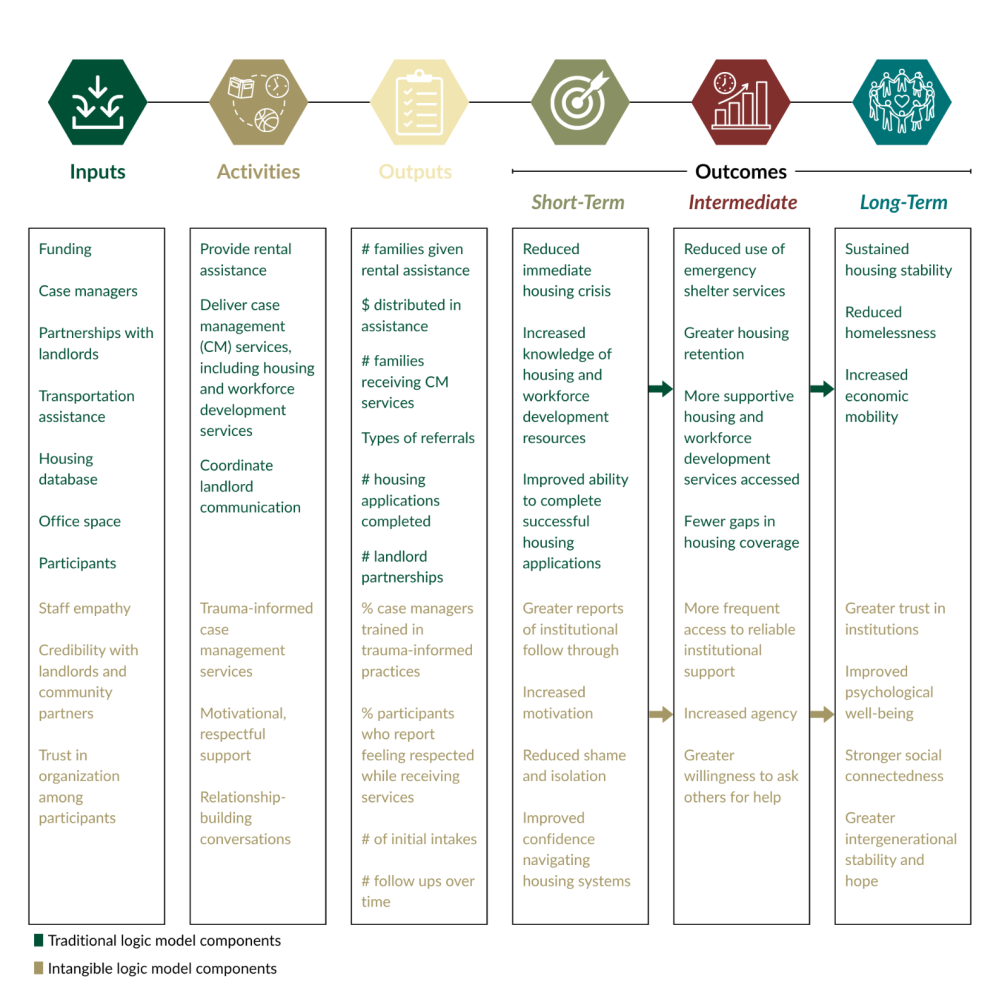
The Impact, Data and Evaluation Academy encourages the following shift for a better formula: Add intangibles to get human-centered outcomes. Figure 2 below demonstrates what it might look like to integrate intangibles into a logic model to more fully capture a housing-specific social impact story.
Figure 2. Intangibles Logic Model Example
Reflecting intangibles in logic models serves two key goals:
- Improve implementation. Tracking humanness (think: psychological, moral, and historical motivators like love, values, and past experiences) can reveal the things that make it easier or harder to run programs.
For example, we can develop an amazing program that will help folks get housed for free, but if many participants are ashamed to get help or don’t trust the staff members housing them, then the program will fall flat.
- Tell a stronger impact story. Human-centered outcomes aren’t just feelings. They’re the attitudes and beliefs that drive human behavior and resonate with listeners. And, attitudes and beliefs can be measured.
For example, we definitely want to know if our housing program meets goals to reduce homelessness. But we also want to know if the program builds trust, hope and agency among participants. That’s the human-centered story behind the numbers, and by telling it we can:
- Keep participants front and center when defining success
- Identify unintended consequences that may hurt the long-term sustainability of programming
- Tell powerful narratives about people, which usually resonate strongly with listeners because they can recognize themselves in the humanness, even if they don’t find themselves in the same circumstance.
Logic models are already tools to make the invisible visible. They are supposed to show the what and the how of the program, and when we map intangibles onto the logic model, it becomes a more realistic, more human, and often more powerful picture of our programs and the communities we work with.
You can use the IDEA reflection tool to begin thinking about intangibles in your own organizational context.
Keep up with the Impact, Data and Evaluation Academy
Email ideacademy@charlotte.edu or click here to schedule a discovery call. You can also sign up for the quarterly IDEA newsletter here.