Census 2010: cities and towns in the Charlotte region

On Wednesday, March 2nd, the first set of data from the 2010 Census was released for North Carolina counties, cities, towns, etc., providing the first hard population counts for these areas since 2000. We know that the Charlotte region as a whole has grown rapidly in the last decade, but how has that growth been distributed among the individual cities and towns in the region? Most of the attention, thus far, has focused on comparisons at the county level with the occasional small-scale comparisons between individual cities and their neighbors. Since the UNC Charlotte Urban Institute is also interested in trends across the region, we examined the new 2010 population numbers for all of the cities and towns that fall in the 11 North Carolina counties of the 14-county Charlotte region (2010 Census data have not been released for South Carolina yet), calculated total and percent change between the 2010 Census figures and 2000 Census figures, and placed this information into an interactive map so our readers could explore their own places of interest.
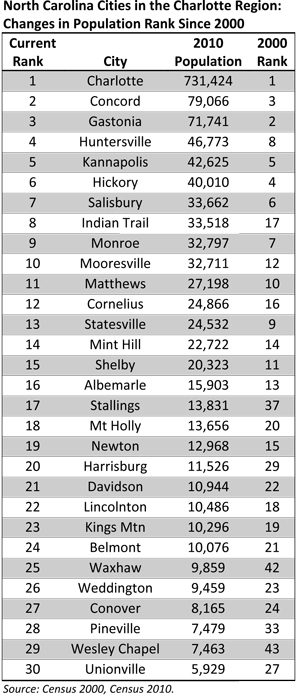 A cursory look at the data reveals a number of interesting trends. First, the vast majority of the ninety-some cities and towns in the region grew in population over the course of the past decade. The magnitude of this growth, however, varied tremendously across the region. The maps at the end of the article illustrate this variation. Although Charlotte remains the principal city in the region and experienced the greatest increase in sheer numbers (190,000), the greatest percentage changes have occurred in the surrounding suburbs.
The first concentration of population growth that jumps out is the cluster of cities in western Union County along Mecklenburg’s southeastern border . These towns experienced some of the highest percent change in the entire region. Many of these places, such as Marvin, Stallings, Waxhaw, and Wesley Chapel, entered the decade with a fairly small base (around 1,000 to 3,000 people), so an increase of a couple thousand people results in noticeably high percentage changes. The main exception is Indian Trail, which grew substantially both in percent and raw numbers and jumped from 17th in population in the region to 8th.
A second notable cluster of growth in the region appears around the cities in north Mecklenburg and south Iredell counties – cities like Cornelius, Huntersville, and Mooresville – which stand out in terms of both percent change and total numbers. Although these places did not see the explosive growth experienced in the smaller southeastern suburbs, they gained more people overall – between 13,000 and 22,000 apiece.
A third, distinct area of growth includes the northeastern suburbs of Harrisburg, Kannapolis, and Concord. This group of cities was less homogenous than those mentioned above. Harrisburg, which started the decade as a mid-to-smaller sized city, grew sharply (over 150%). Kannapolis, one of the largest cities in the region, experienced more moderate growth (15.5%). And Concord, the largest of the three, gained around 23,000 people (an increase of 41.2%), enough to overtake Gastonia as the second most populous city in the region.
These prominent areas of suburban growth stand in contrast to the stalwarts of the region for many previous decades, cities such as Salisbury, Statesville, Gastonia, Lincolnton, Shelby, and Albemarle. With their focus on local government and manufacturing, these “courthouse” towns were once engines of growth for the region and, outside Charlotte, formed the backbone of the region’s population for decades. In this first decade of the 21st-century, however, these cities have seen some of their smaller neighbors catching up with, and even surpassing them in population as suburban growth from Charlotte has spread outward. Each of these cities experienced less than 10% growth between 2000 and 2010, and all fell in rank.
The trends described above are just a few of the many initial observations we have made of the newly-released 2010 Census data, and all of them will require further investigation in order to address the reasons for the various growth patterns emerging throughout the region. In the coming weeks, we will be delving deeper into the 2010 Census data, exploring changes in the racial and ethnic composition of the region’s cities and towns and how those differences have affected overall growth.
The two maps below show the total change and percent change in population for cities from 2000 to 2010 – the larger the circle, the greater the change. To see an interactive map that shows these data, click the button below.


— Laura Simmons & John Chesser
Photograph by Nancy Pierce
Source for map: Census 2000, Census 2010