Charlotte and Raleigh top U.N. list of fastest growing large U.S. cities

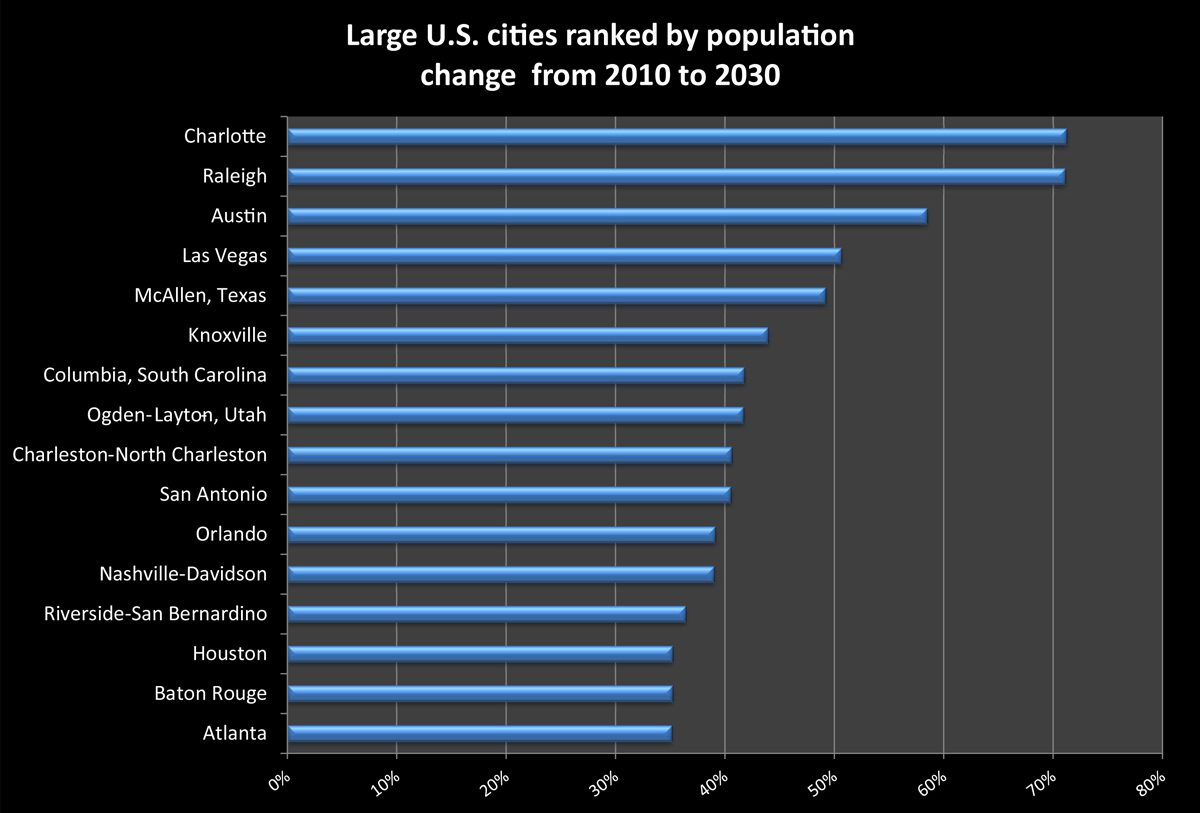
City population projections produced by the United Nations show Charlotte and Raleigh as growing the fastest among large U.S. cities from 2010 to 2030.
The United Nations produces population estimates and projections for cities from Shanghai to Johannesburg – including cities in the U.S. The U.N. uses areas it calls “urban agglomerations,*” which measure the continuously built-up areas around central cities. It’s a different measure from the Metropolitan Statistical Area used by the U.S. Census Bureau.
In the U.N. projections, Charlotte and Raleigh stand out among U.S. cities of 500,000 inhabitants or more with nearly identical projected population increases of 71 percent from 2010 to 2030. The graph below shows that Austin, Texas, is next in these projections at 58 percent population change during the period.

Several smaller cities across the country have faster projected increases. The Woodlands, a master-planned community north of Houston, has a 171 percent projected increase, followed by Temecula-Murrieta, Calif., with a 100 percent increase.
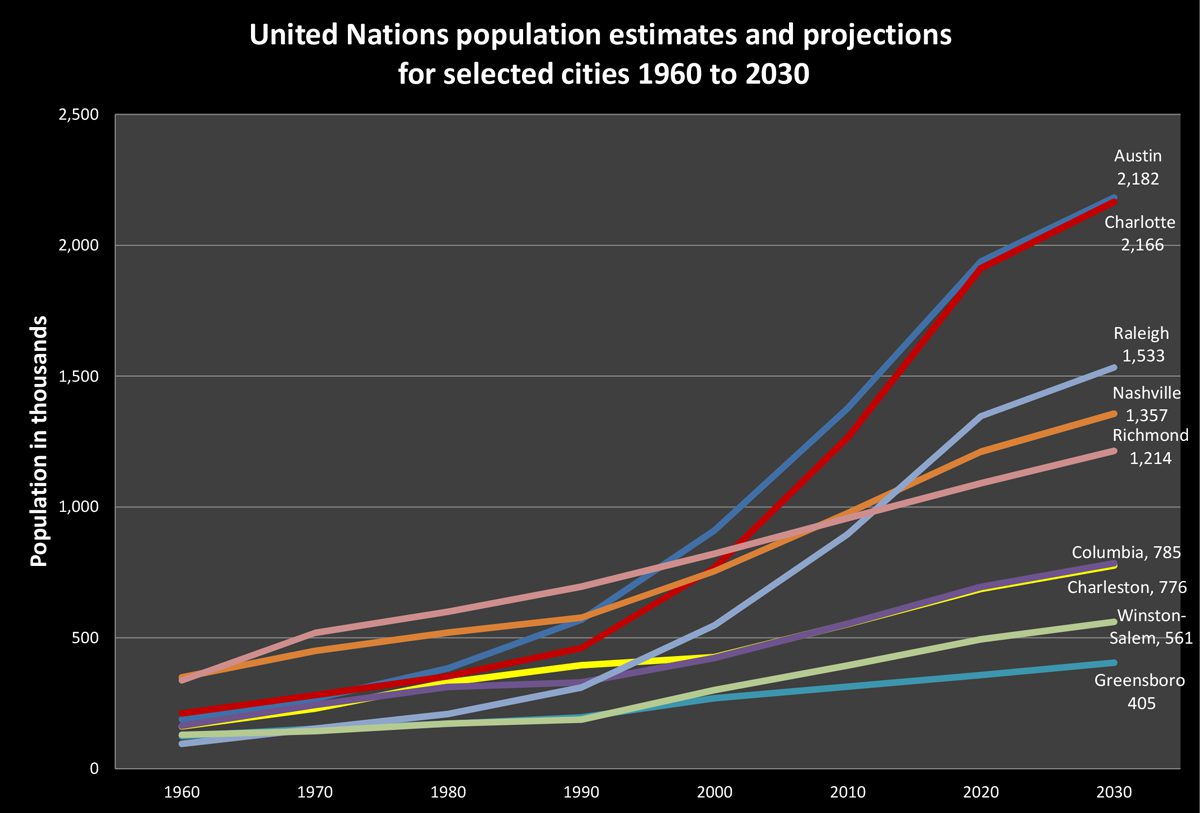
The rapid growth projected for Charlotte and Raleigh as compared to several other southeastern cities (table below) shows the potential for a different urban hierarchy across the South. Austin’s projected rapid rise is also shown, since it parallels Charlotte’s in these projections.

The graph shows a tightly grouped set of small cities in the mid-20th century, when the South was a much less urban place. In the 1990s Charlotte and Raleigh grew more quickly than their neighboring cities.
Atlanta (not shown in graph), is projected to grow to more than 6 million by 2030, reinforcing its status as the South’s largest city.
The U.N. projections measure urban areas that are physical, rather than functional, using the geography of continuous built-up areas. By comparison, the Census Bureau’s MSAs are functional urban regions, typically larger geographic areas, and are based on commuter patterns within urban regions. Both methods have their merits. The U.N. projections give an indication of the growth and spread of built-up city areas throughout the South since the last decade of the 20th century. That pattern typically has lower residential density here, giving the South more built-up area for the size of the population than other parts of the globe.
*The concept of agglomeration defines the population contained within the contours of contiguous territory inhabited at urban levels of residential density without regard to administrative boundaries.
Data for this article are from: United Nations, Department of Economic and Social Affairs, Population Division (2014). World Urbanization Prospects: The 2014 Revision. File 12: Population of Urban Agglomerations with 300,000 Inhabitants or More in 2014, by Country, 1950-2030 (thousands). These data are published in World Urbanization Prospects, which shows a long period of historical data as well as projections to 2030 for world cities.