The Charlotte region’s data encyclopedia

Whether you need to know what county in the Charlotte region grew the fastest last year, or where in the region support for the arts is strongest, a new interactive tool can answer your questions. Table Explorer, available through the Charlotte Regional Indicators Project contains a wide range of data for the Charlotte region as well as comparative data between the Charlotte metro area and selected metro areas across the U.S.
In the last two years, the Charlotte Regional Indicators Project has been assembling and updating data for the 14 counties that make up the region1 as well as data on comparative metros across the U.S. The database was designed to be updated regularly with the most recently available information. Partnerships with community organizations are creating even more resources for understanding what is happening in our region (http://ri.charlotte.edu/partners). Table Explorer opens this large and growing database to public access for researchers, students or any resident who wants to be better informed about this region.
Understand trends
Data for the chart below was downloaded from Table Explorer and graphed using Excel in just a few minutes.

It shows the widely used Case-Shiller housing price index was higher for the Atlanta metro region early in the decade, but by 2011, the Charlotte and Atlanta metros had switched places in the index after hitting peaks at different points in the decade. The Charlotte-Gastonia-Concord NC-SC MSA (metropolitan statistical area) covers Anson, Cabarrus, Gaston, Mecklenburg, Union and York (S.C.) counties.
Explore regional differences
Data available within the region can quickly show how local counties compare now and how they may be changing.
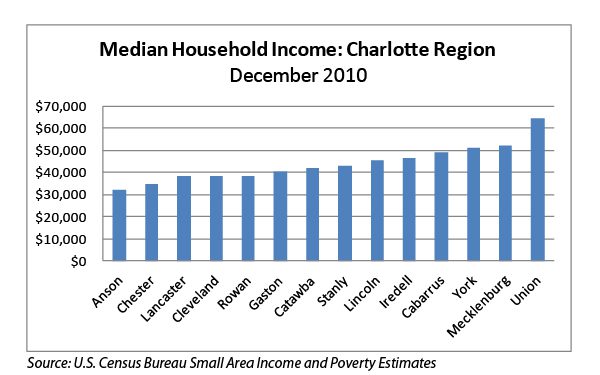
Median household income (graphed above) in Union County southeast of Charlotte was significantly higher than Charlotte’s home county of Mecklenburg in 2010. Another query from the Table Explorer shows that in 2001, Union and Mecklenburg median household incomes were nearly identical ($50,648 in Union vs. $50,604 in Mecklenburg).
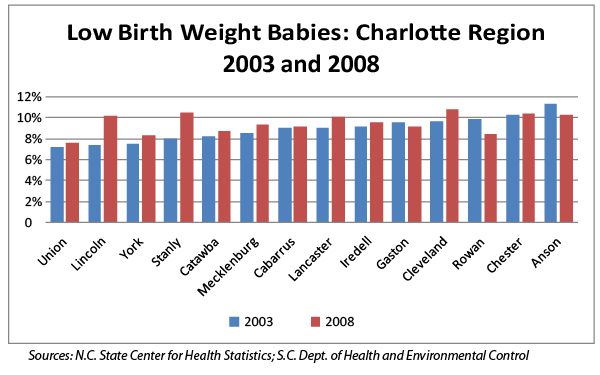
Above is an example of one of the health-related items in the data. By choosing two years and sorting the data by the first year, it is easy to see which counties had improvements in this measure between 2003 and 2008 (Gaston, Rowan and Anson).
What’s available in Table Explorer
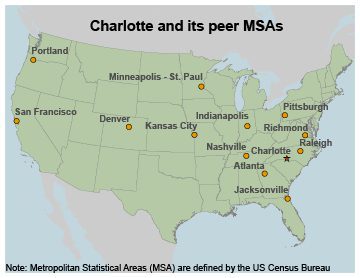
The data available through Table Explorer cover a range of topics in the Charlotte region and compare the Charlotte Metropolitan Statistical Area (MSA) to a selection of other MSAs across the country.
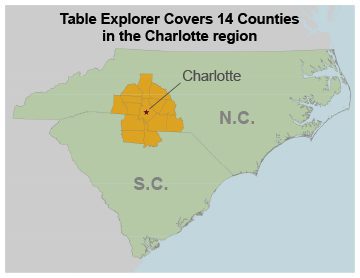
The maps (left) and list below show the geographic and topical coverage of the data in Table Explorer.
|
Data Available in Table Explorer Arts, Recreation and Cultural Life |
Some items in the database are available beyond the 14-county Charlotte region (covering the full set of N.C. and S.C. counties). Data items are released on different schedules, so the best way to understand what is available is to explore the data using the table builder tool.
The Table Explorer wizard takes the user through the steps to build a query. A video at the bottom of the wizard page (and below) goes through the process of building a query as an example. The final results of a query can be exported to formats like Excel (and then graphed in Excel as the examples in this article), or users can create tables and graphs directly in Table Explorer. Click here to open Table Explorer.
The Charlotte Regional Indicators website (http://ri.charlotte.edu ) offers several ways to explore and analyze data in addition to Table Explorer. Indicator Explorer presents data in interactive charts by theme for the entire Charlotte region. Regional Explorer provides further detail by presenting data for each county in the region in a similar interactive graphing tool. Indicators Partners pages offer more in-depth data and analysis of items of special interest to those organizations. So far, additional data have been compiled in partnership with Charlotte-Mecklenburg Women’s Summit, Council for Children’s Rights, MeckEd, United Way of Central Carolinas and Urban League of Central Carolinas (click the links to each agency to see additional indicators available for exploration and analysis). Pages for Goodwill Industries of the Southern Piedmont are under way and will be available later this spring. Table Explorer functions will be available on data partner pages in the next few weeks. Indicator Explorer features are already functioning on active data partner pages.
These tools on the Regional Indicators pages are part of a set of resources for information on the Charlotte Region. There is a growing library of commentary, analysis and essays on the region at UNC Charlotte Urban Institute’s website (http://ui.charlotte.edu). Additionally, the recently launched www.PlanCharlotte.org focuses on growth, urban and environmental issues. Together, these sites are creating resources of both detailed data and context, to help put the dynamics of this region into perspective.
The video tutorial for Table Explorer is available below on this page.
1The fourteen counties for which the Charlotte Regional Indicators Project collects and maintains data are: Anson, Cabarrus, Catawba, Chester (S.C.), Cleveland, Gaston, Iredell, Lancaster (S.C.), Lincoln, Mecklenburg, Rowan, Stanly, Union and York (S.C.).
Video tutorial: How to use Table Explorer