Data that show why Charlotte houses are so expensive – and scarce
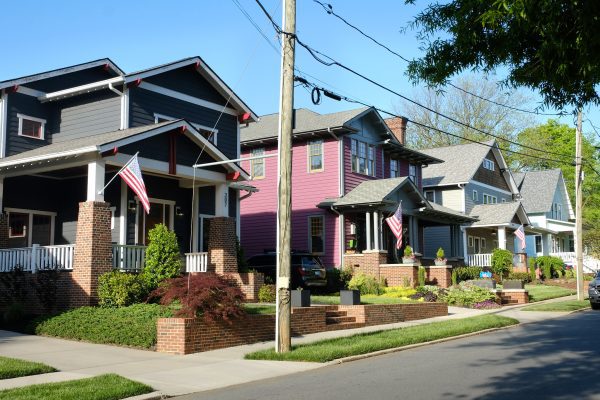
Buying a house in the Charlotte region has, in many ways, never been more challenging. Buyers face a dizzying array of obstacles: A historic supply crunch, skyrocketing prices and homes that sell faster and faster each month.
The reasons are numerous. Housing supply never fully recovered after the 2008 economic crash and Great Recession drove homebuilders out of business; pandemic-driven demand for more living space; the massive growth of Wall Street-backed corporate landlords that bought single-family homes over the past decade, and Millennials, the biggest generation, entering their prime home-buying years. It all adds up to frustration, anxiety and a delayed American dream for millions of families across the U.S.
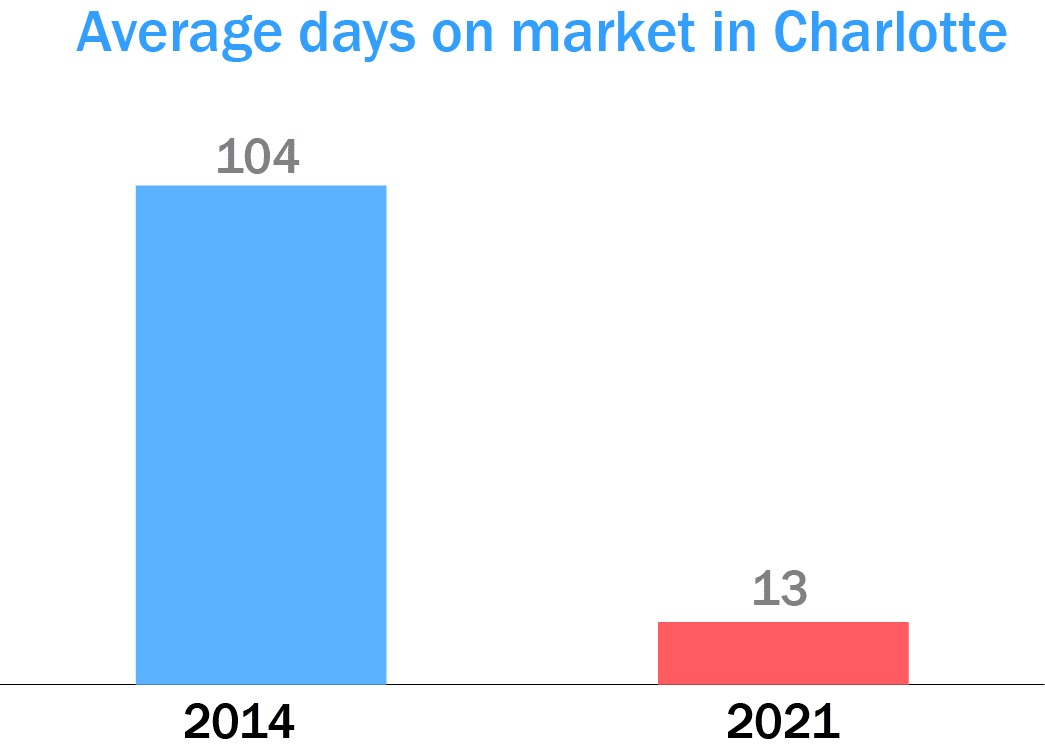
Many statistics can help illustrate just how tough this real estate market is for buyers. The following charts are generated mostly from data supplied by the Canopy Realtor Association, which tracks and releases statistics for the Charlotte region monthly, as well as the U.S. Census. One data point in particular shows just how competitive and stressful Charlotte is for home buyers: how long a house stays on the market, on average, before a sale. If you were trying to buy a house in 2014, time was on your side.
That’s not the case today.
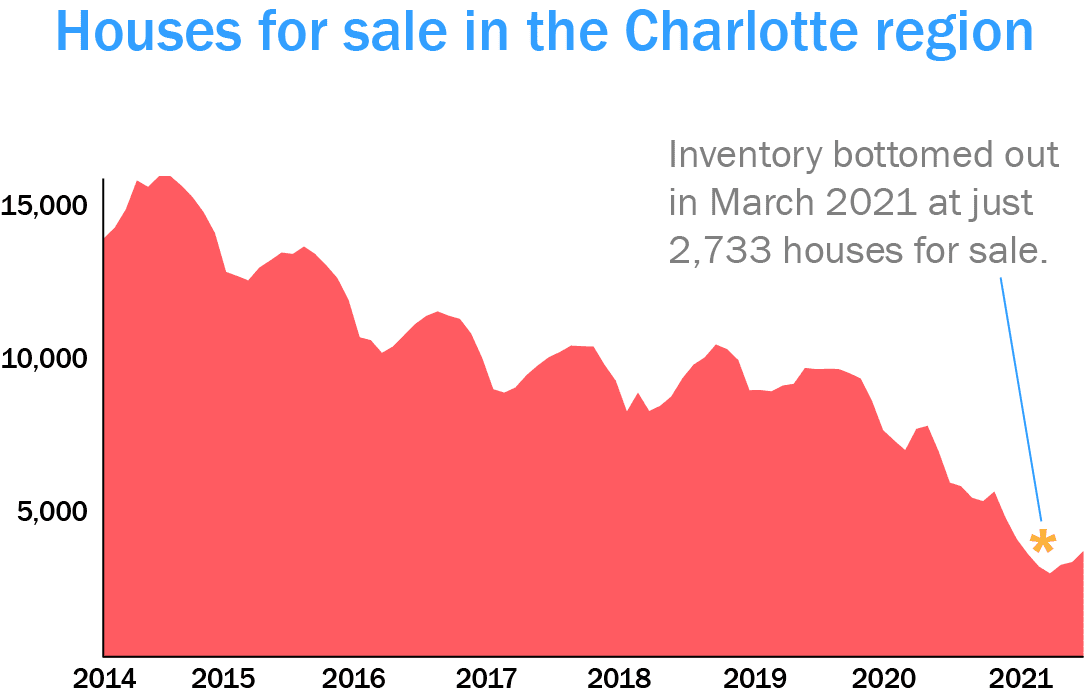
Not only are houses selling faster, but fewer are available at any given point. One of the biggest reasons is that the supply of houses simply hasn’t kept up with demand. Inventory across the Charlotte region has fallen dramatically in the past few years, dropping sharply over the past year in particular. In real terms, that means potential buyers have thousands fewer houses to choose from each month than they did just a few years ago.
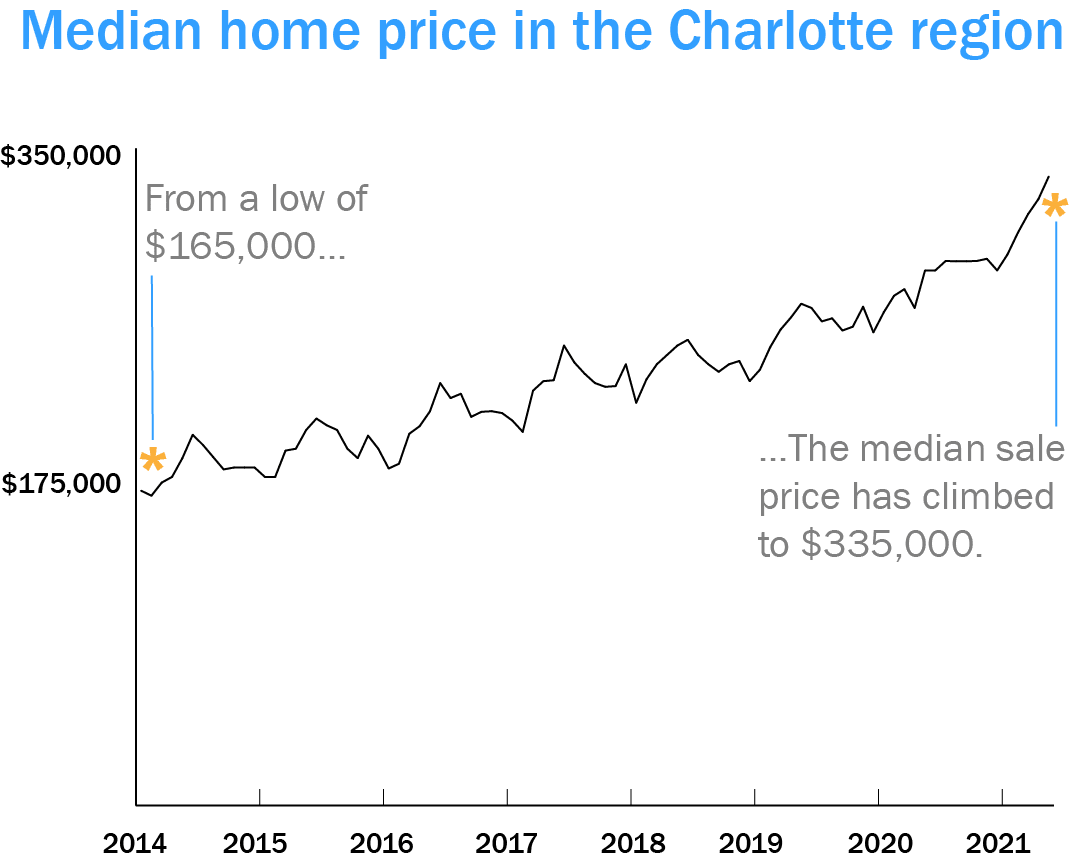
And the law of supply and demand remains in effect: If supply goes down and demand goes up, prices increase. The median sales price has nearly doubled in seven years across the Charlotte region.
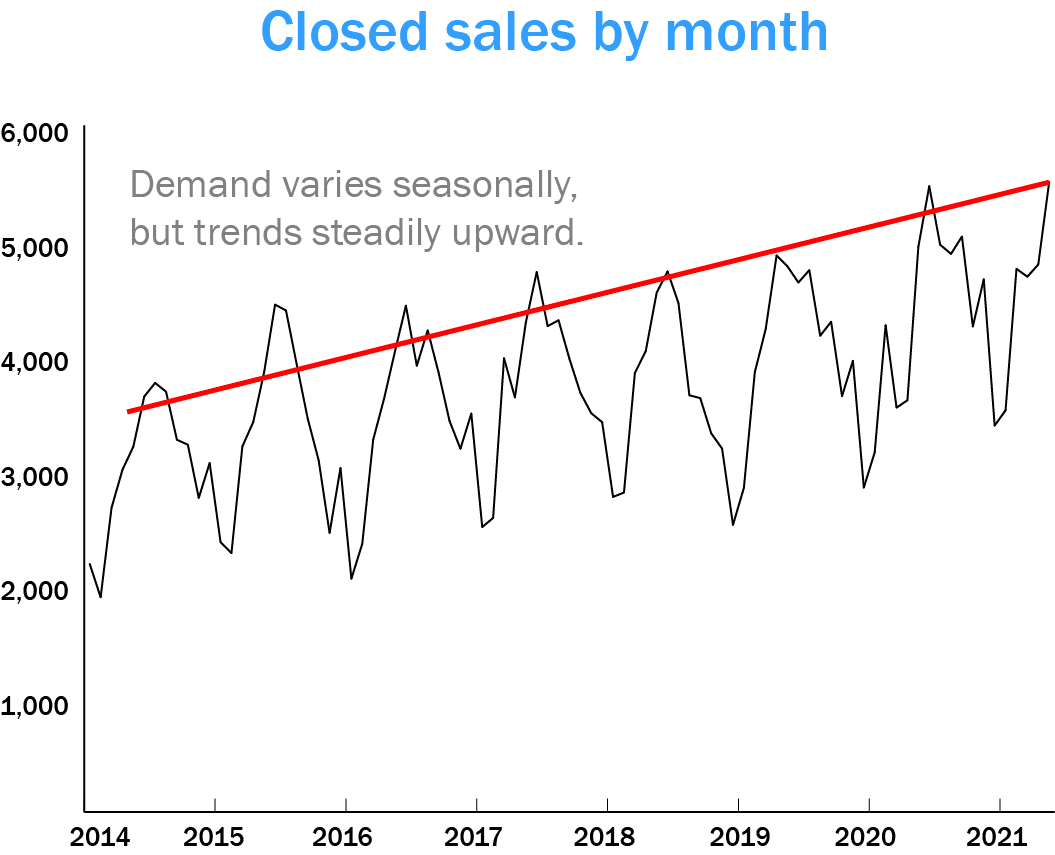
Despite the rise in prices, demand isn’t slowing. The number of sales closed each month has risen steadily, even during the coronavirus pandemic.
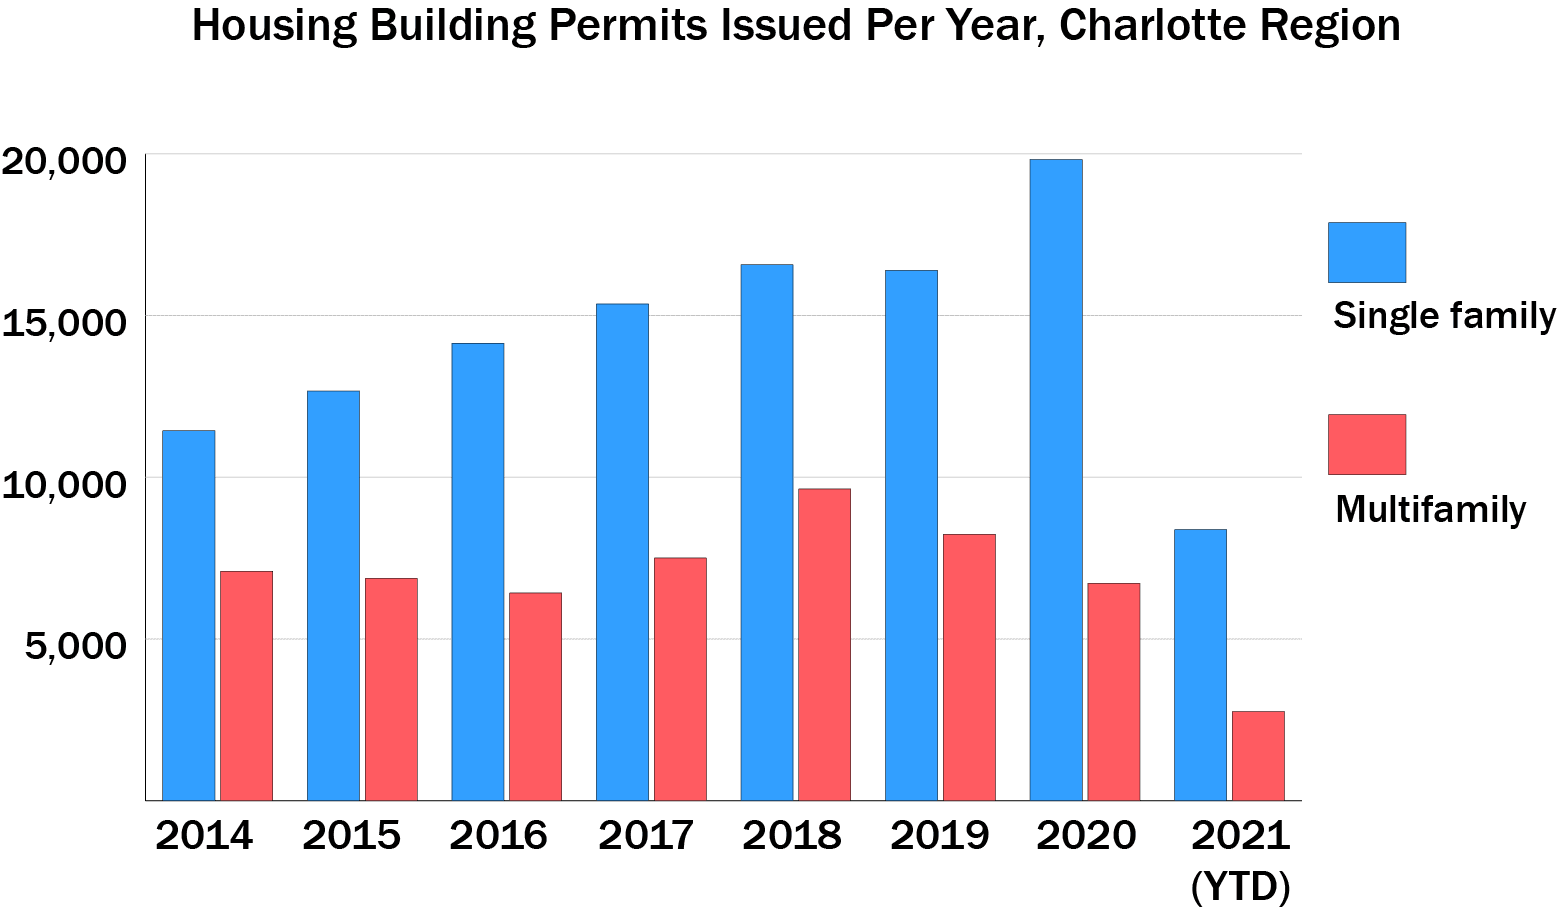
Meanwhile, builders have been attempting to keep pace. Permits have steadily risen, nearly doubling since 2014. And, despite the perception that Charlotte is swimming in new apartments, single family home building permits make up a larger share of the total now than they did five years ago, while multifamily building permits have declined.
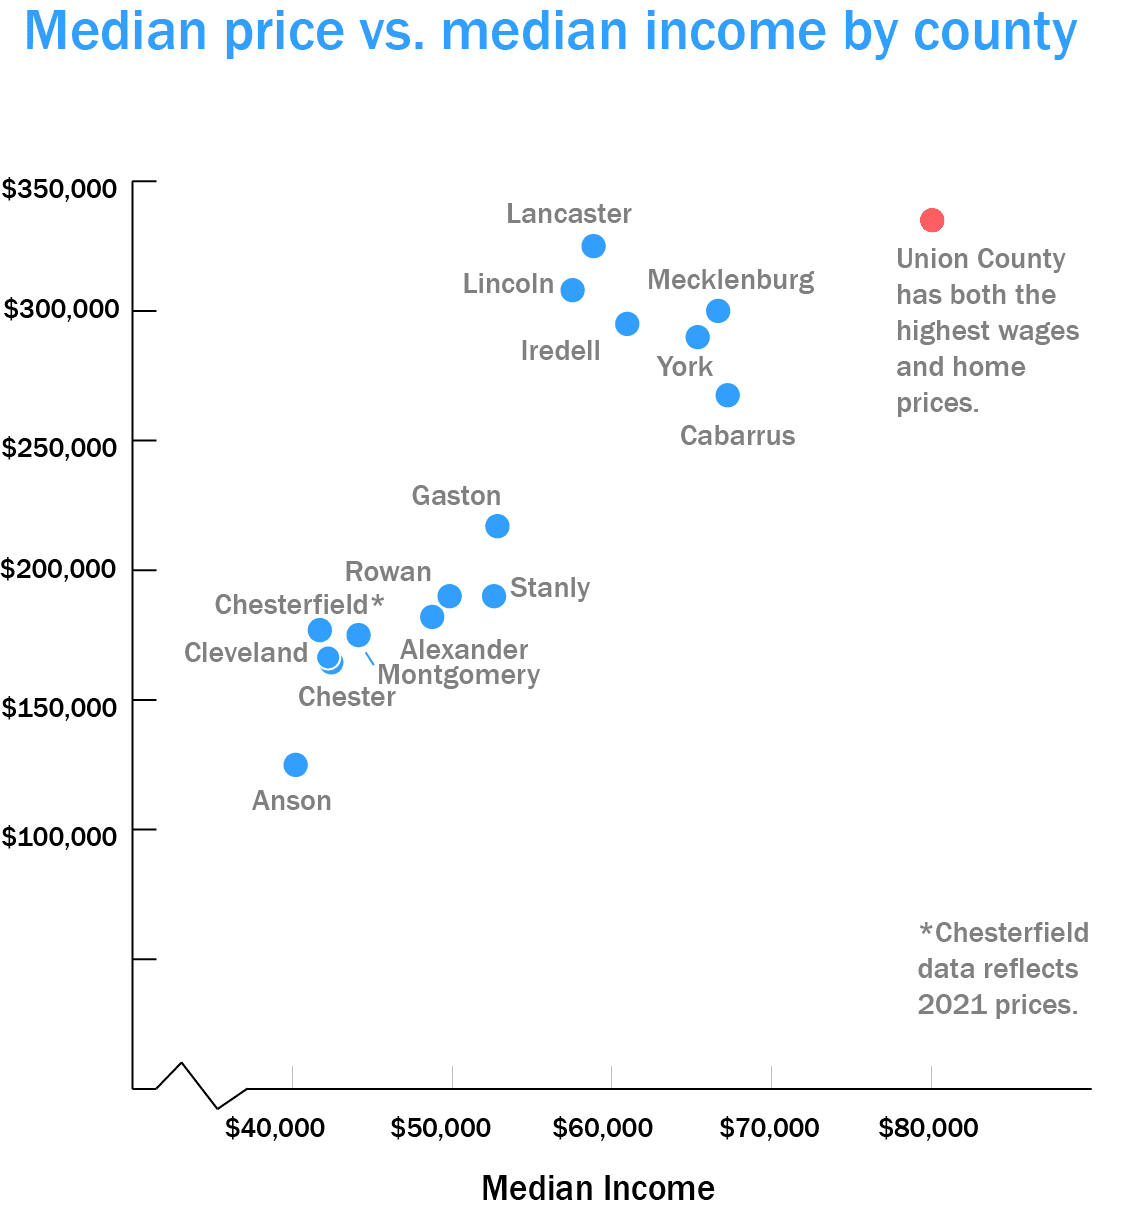
Counties with higher median incomes tend to have higher median home prices. In fact, there are two main clusters of counties: Those with lower incomes and lower home prices and those with higher incomes and higher home prices.
But within those groups, there are some affordability differences. For example, Mecklenburg and Cabarrus have similar incomes, but houses in Cabarrus average almost $33,000 less.
Charts and text by Ely Portillo
Data sources: Canopy Realtor Association, U.S. Census