Explore these data sources to learn more about Charlotte
Charlotte is a fast-growing city where the skyline changes by the month and neighborhoods are reshaped at a disorienting pace. But there are a multitude of data sources to help you understand the city and your community.
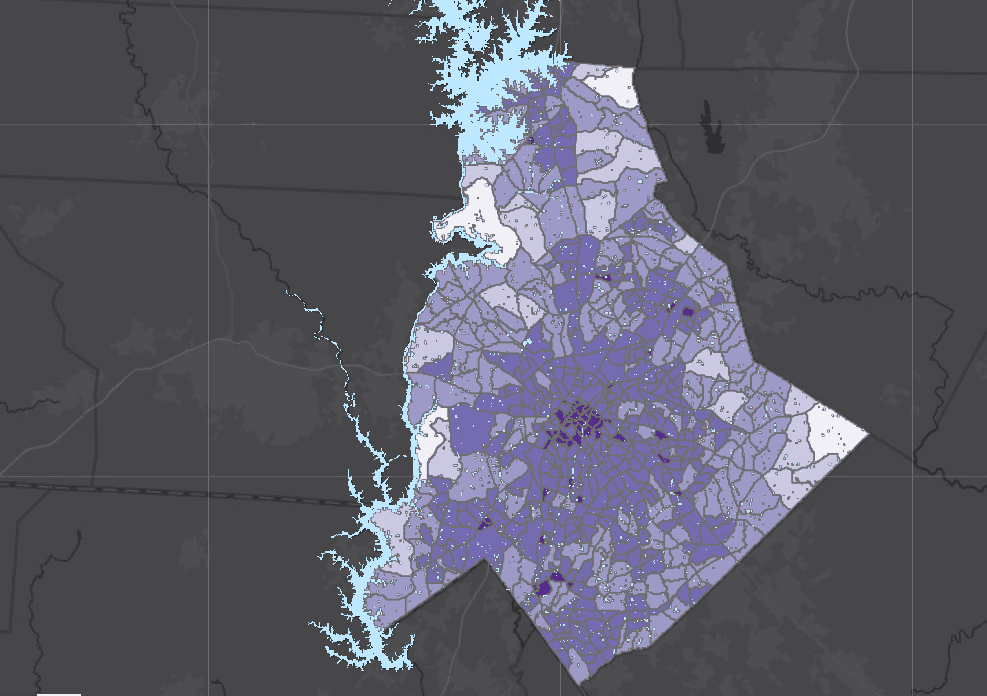
You can start with interactive maps like the Quality of Life Explorer (produced by the Urban Institute in partnership with the city of Charlotte and Mecklenburg County), which graphically display about 80 variables ranging from average education level to household income to proximity to pharmacies.
In addition to the institute’s data resources, you can also check out the following online sources to explore specific topics:
Displacement risk
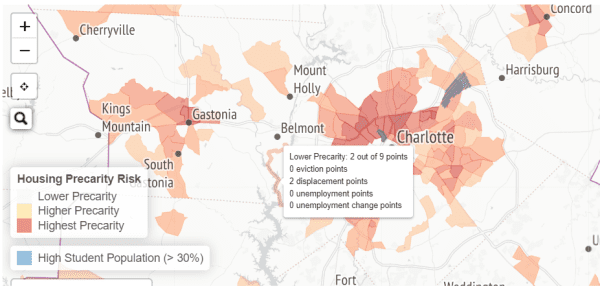
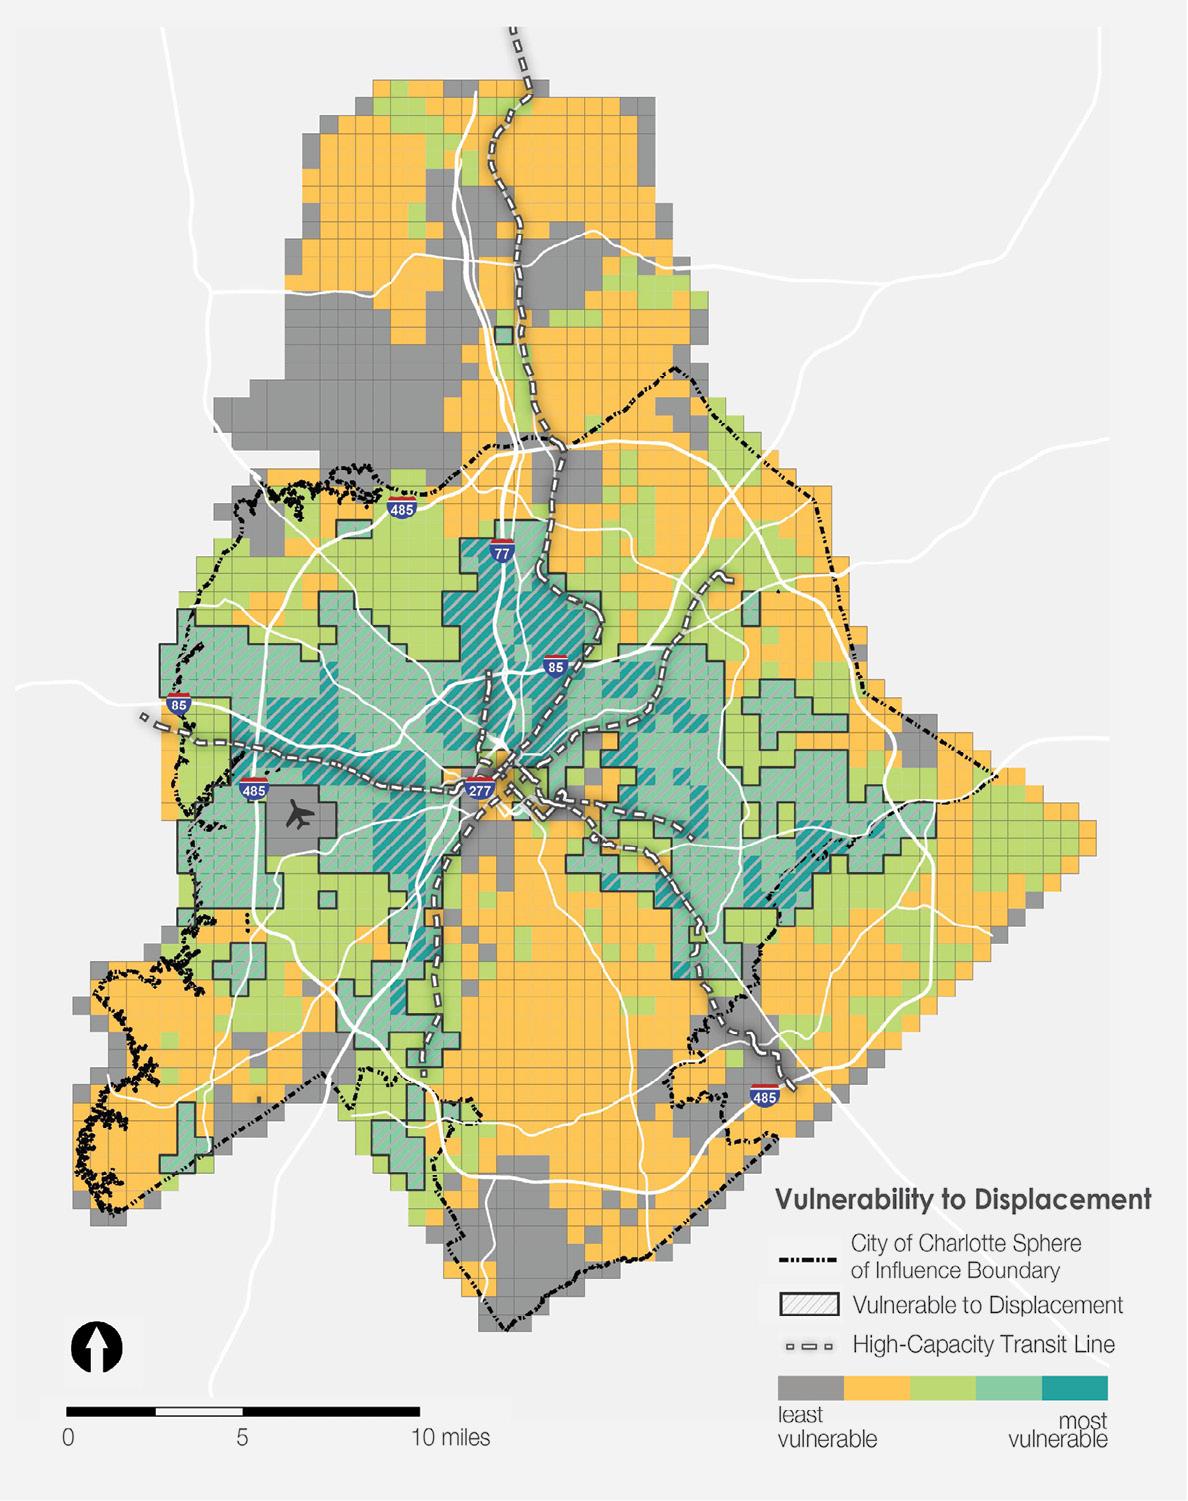
Gentrification and redevelopment are major forces in Charlotte’s growth. Lower-priced, often historically minority-majority neighborhoods around Charlotte’s city center are changing quickly, with home prices and rents shooting up.
Combined with the city’s overall housing shortage, that makes for major worries about displacement. The Urban Displacement Project has created a tool to visualize where the risk of residents being displaced is highest. Zoom in on Charlotte and click the Housing Precarity Risk Model Map for more.
You can also see how the city of Charlotte is approaching the issue in its new 2040 plan and Unified Development Ordinance, under development now.
Source: City of Charlotte
Building permits
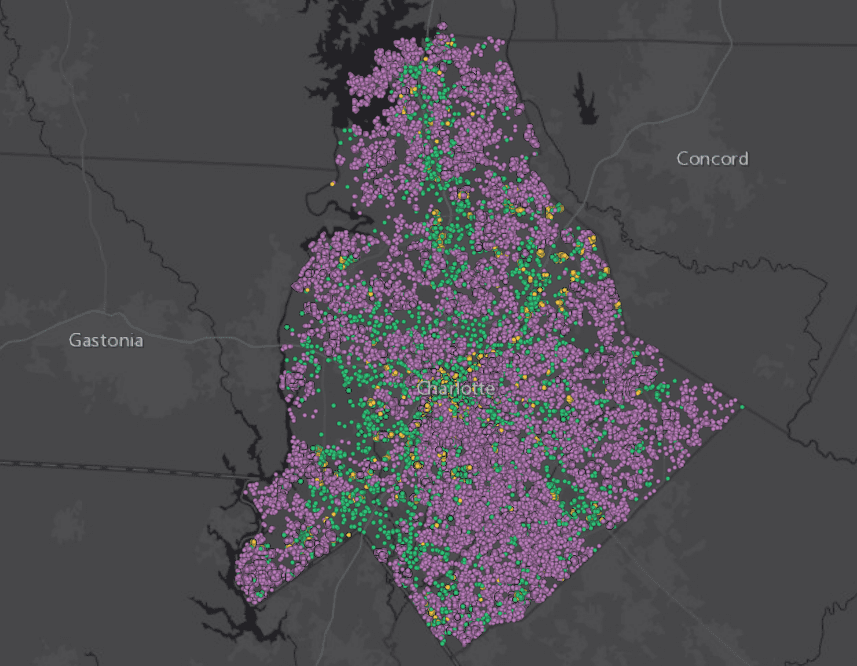
Want to see exactly where growth and development are happening? Mecklenburg County has created an interactive map with all the building permits from 2010-2020, broken down by type (single-family, multifamily and commercial) with cost and other key information provided as well.
Source: Mecklenburg County
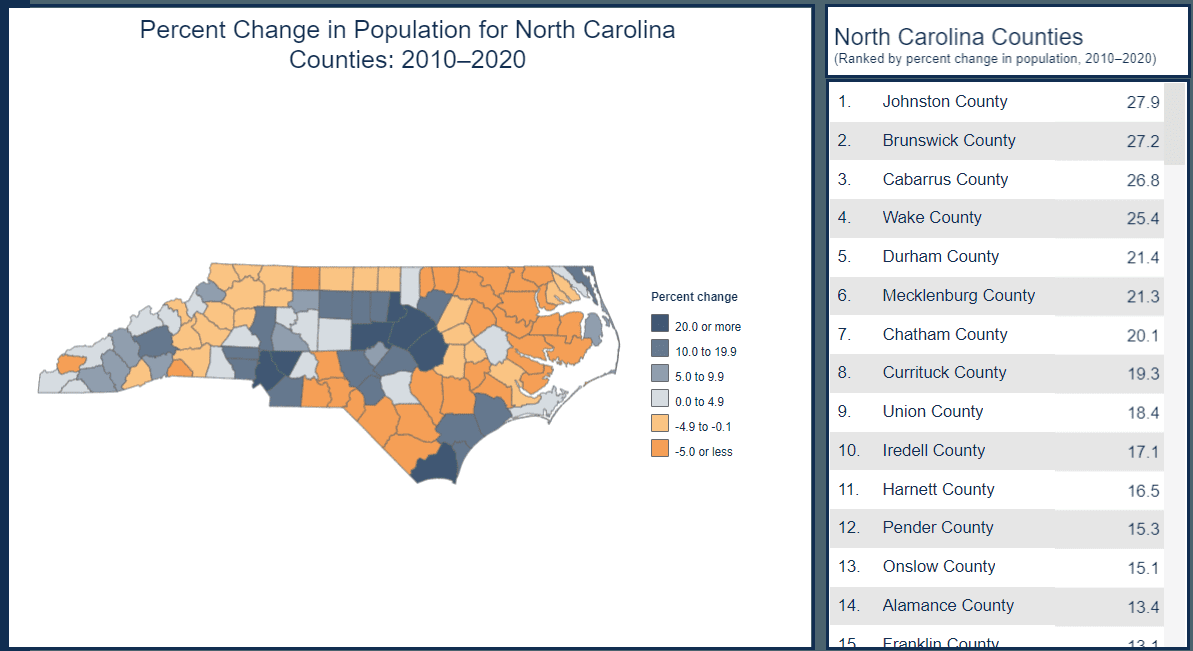
Census data
The U.S. Census Bureau has an enormous amount of data available, of course. A high-level overview of county-level data is available in a shareable, embeddable form, allowing you to generate and visualize maps including percentage changes in housing units, population, housing vacancy rate and more.
Impervious surface map
Another aspect of growth: Cutting down trees, building things and paving new areas. From 2011-2021, 13,539 acres of land were covered by buildings, streets, sidewalks and other impervious surfaces in Mecklenburg County. That’s equivalent to the towns of Matthews and Pineville combined. You can see where the most new coverage happened on this interactive map.
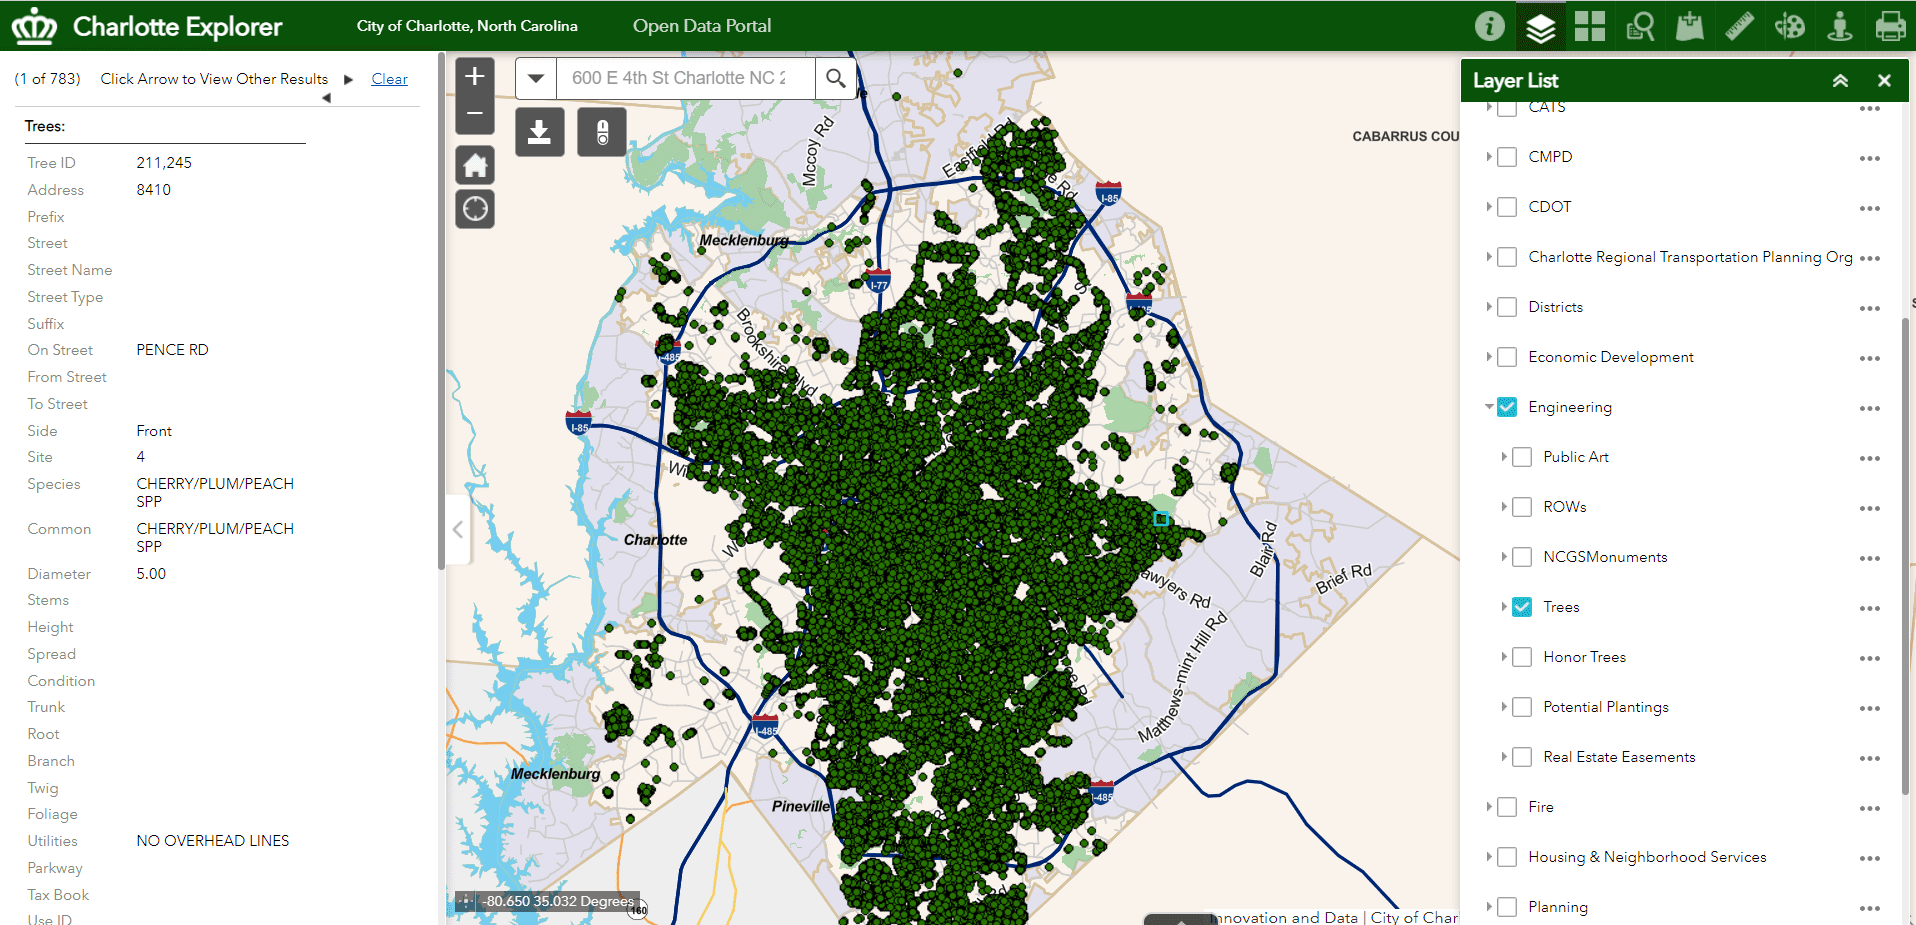
Charlotte Explorer
Looking to see where all the transit stops are? The exact route for new planned rail lines? How City Council districts break down? Storm drains across the city? The city’s annexation history and growing borders by decade? The location and type of all the city’s street trees? Where all planned capital improvement projects are located? You can find all that and more in the Charlotte Explorer, one of the city’s most comprehensive data resources.