Gaston agencies, foundation work with institute to create new online resource

A new data resource about Gaston County is available through online, interactive dashboards. Trends on the county’s demographics, economy, education, health and quality of life are tracked and compared to peer counties as well as state and national figures.
This represents a continuing partnership coordinated by Gaston Together and other local Gaston County groups with UNC Charlotte’s Urban Institute. Support from the Community Foundation of Gaston County has allowed for the interactive data tool to be made public on the web.
|
Explore Gaston’s data Click here to see the new data tool available for Gaston County (or scroll below to see a sample dashboard). See basic demographic data on the county here. |
Gaston is the first county in the Charlotte region to become a data partner with the UNC Charlotte Urban Institute, as a part of the institute’s Regional Indicators Partners program. The Charlotte Regional Indicators Project tracks and assesses key indicators of quality of life for the 14-county, two-state region around Charlotte. The project provides objective, reliable and relevant data measuring the region’s progress on a wide range of social, economic, and environmental indicators.
To complement the Charlotte Regional Indicators Project, the institute launched the Indicator Partners Program in 2010. This is an initiative to form long-term, strategic data partnerships between the institute and community organizations.
Gaston Together looked to community agencies to help fund the development phase of their indicator partnership. Gaston College, Gaston Family Health Services and the Gaston County United Way partnered to invest in the project.
In 2013, the Community Foundation of Gaston County provided support that has made the data on the site available to the general public. Now, anyone can access information for planning purposes, grant writing and marketing. The site also creates a common base of knowledge to identify strengths and weaknesses, community needs and successes. The goal is to provide the greater community with the data and evidence needed to achieve better outcomes for its citizens.
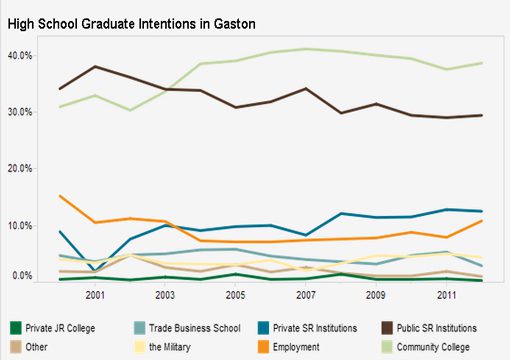
Scroll below to see an example of one of the interactive dashboards.
<a href=’#’><img alt=’ ‘ src=’http://public.tableausoftware.com/static/images/YH/YH3KHSC9D/1_rss.png’ style=’border: none’ /></a>