Mapping de facto segregation in Charlotte-Mecklenburg Schools

After boasting one of the nation’s most successful mandatory busing plans to desegregate the district’s schools, Charlotte-Mecklenburg Schools (CMS) has once again become increasingly segregated. This shift has been documented meticulously through numerous recent studies and disseminated to the public through coverage in the local media. In partnership with Council for Children’s Rights, as part of their school-readiness campaign, the UNC Charlotte Urban Institute recently identified and mapped high-minority and high-poverty CMS schools, which were then highlighted at The Lunch for Children’s Rights on September 21st. The results were striking.
Throughout the 1970s, ‘80s, and ‘90s, CMS used a busing system to desegregate its schools in compliance with the landmark Swann v. Charlotte-Mecklenburg Schools (1971) decision. In 1997, the Swann ruling was overturned, and CMS was ordered to abandon its desegregation efforts. In the fall of 2002, a race-neutral school choice plan was instituted. What followed was essentially a reversal of desegregation, a trend that is documented by Stephen Samuel Smith in his chapter in the recently released Charlotte, NC: The Global Evolution of a New South City. Smith writes, “The CMS of the pre-Swann era with its brutally sharp segregation between blacks and whites may be a thing of the past. But the CMS of the post-Swann era with its increasing segregation between non-Hispanic whites, on the one hand, and blacks and Hispanics, on the other hand, is very much a thing of the present.”[1]
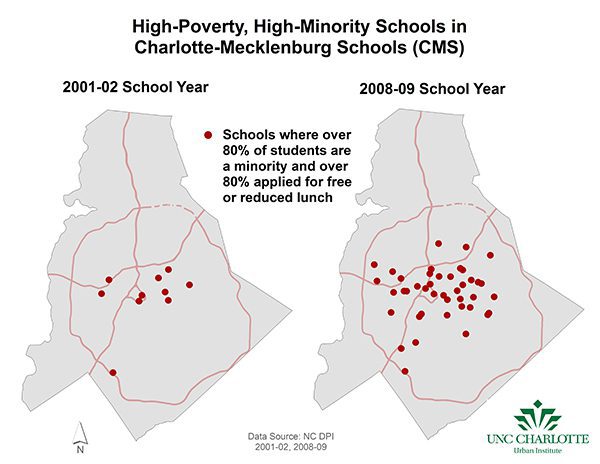
Smith’s observations truly crystallize when communicated through a series of maps. Using data from the North Carolina Department of Public Instruction, the percentage of students who were a minority and those who applied for free or reduced lunch (a frequently-used measure of poverty in schools) were calculated and mapped for each CMS school in the 2001-02 school year (the last year of race-based busing) and the 2008-09 school year (the most recent year data were available for both indicators). The resulting maps show those schools that were both high-minority and high-poverty (over 80% of students were a minority and over 80% applied for free or reduced lunch).

These maps make two important statements. First, the number of high poverty and high minority schools has multiplied noticeably since the adoption of school choice. In 2001-02, there were 10 schools with student populations over 80% minority and applying for free or reduced lunch; in 2008-09, there were 42. Second is the geographic distribution of these schools- forming a band across the middle of the county with a notable, albeit not unexpected, absence in the more affluent south Charlotte and northern half of the county.
The resegregation occurring in CMS is especially troubling given the achievement ramifications segregated schools have for minority and low-income students (who already experience considerably lower test scores and graduation rates than their white and higher income peers[2]). There is growing scholarly evidence that desegregated classrooms enhance learning and opportunity, not because of diversity in and of itself but due to greater equity in the distribution of resources[3][4]. As demonstrated in U.S. Secretary of Education Arne Duncan’s recent visit to Sterling Elementary, high-minority, high-poverty schools can succeed, but they need significant attention and resources to do so. During his visit, Duncan stated, “We want to turn pockets of excellence into systems of excellence.”[5]
Since the beginning of the 2010-2011 school year, it has become clear that big changes are likely on the horizon for CMS. In September, Charlotte’s philanthropic community announced the launch of the CMS Investment Study Group, which will deliberate on how to reduce the district’s achievement gap. Less than a week later, the school board announced the eminent reshuffling of 30-some CMS schools (half of which appear on the above maps as high-minority, high-poverty schools) to improve efficiency in what is likely to become an increasingly tight budget. Finally, Secretary Duncan’s visit to Charlotte highlighted what is possible when a concerted effort is made to provide a struggling school with top-quality teachers and principals. What better time than now, with the momentum for change mounting, to address the issues raised in Smith’s work and illustrated in these maps?
— Laura Simmons and Claire Apaliski
Photo by Nancy Pierce
[1] Smith, S. S. (2010). Development and the politics of school desegregation and resegregation. In W. Graves & H. A. Smith (Eds.), Charlotte, NC: The Global Evolution of a New South City(pp. 199). Athens, GA: University of Georgia Press.
[2] North Carolina Department of Public Instruction. Reports of Supplemental Disaggregated State, School System (LEA) and School Performance Data; 4-Year Cohort Graduation Rate Report. Retrieved from: http://abcs.ncpublicschools.org/abcs/
[3] Mickelson, R. A. (2001). Subverting Swann: First- and second-generation segregation in the Charlotte-Mecklenburg Schools. American Educational Research Journal, 38 (2), 215-252.
[4] Godwin, K. R., Leland, S. M., Baxter, A. D., & Southworth, S. (2006). Sinking Swann: Public school choice and the resegregation of Charlotte’s public schools. Review of Policy Research, 23 (5), 983-997.
[5] Charlotte-Mecklenburg Schools. (2010, September 15). Overheard during Secretary Duncan’s visit. Retrieved from: http://www.cms.k12.nc.us/News/Pages/OverheardduringSecretaryDuncan%27sVisit.aspx