Part 1: How the Blue Line Extension changed Charlotte development
The pandemic has transformed so much about the world, including how we work, where we work, and how we commute. As a result of these shifts, Charlotte area transit use has fallen to less than 50% of pre-pandemic levels.
And while debates continue on whether these effects are permanent or temporary, city planners are pushing for transit expansion.
The ambitious “Charlotte Moves” plan calls for rail and bus rapid transit connections to Charlotte Douglas International Airport, Matthews, Ballantyne, Huntersville, North Mecklenburg and even into Gaston, Iredell and Union Counties. The latest estimates place the total cost for these projects at $13.5 billion. That’s in addition to the nearly $1.1 billion recently spent on the Blue Line Extension (BLE).
With billions already invested, and more planned for the future, what has been the impact of transit on new development? And will new development encourage more transit use?
Data
Using data from Mecklenburg County’s permitting database, which includes latitude and longitude positions, I was able to map nearly every building permit filed since 2001. In total, there were about 250,000 recorded permits for new construction countywide.
I then flagged only the permits within approximately ¼ mile of the Blue Line Extension. This allowed me to compare development growth along the BLE to the overall development trends in Charlotte. I chose this distance for several reasons:
First, according to the Federal Highway Administration, most people are only willing to walk between ¼ and ½ mile to access a transit station. As the distance to a transit stop increases beyond ½ mile, the willingness of pedestrians to ride public transit decreases sharply.
Second, the city of Charlotte has been working to rezone parcels along the light rail to Transit Oriented Development. In 2019, more than 1,500 parcels were rezoned to higher density uses. TOD encourages increasing arterial connections, a mixture of uses, and taller buildings; all of which promote neighborhood walkability and ridership.
Construction spending
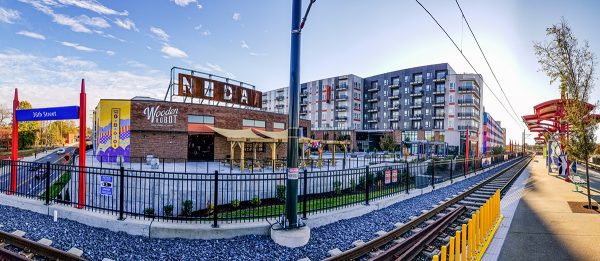
The results were in line with the expectations that I had from casual observation — that construction has noticeably increased since the light rail was completed. Driving along North Davidson or North Tryon, it’s hard to miss the dozens of new apartment complexes and restaurants that have popped up.
 This analysis found that:
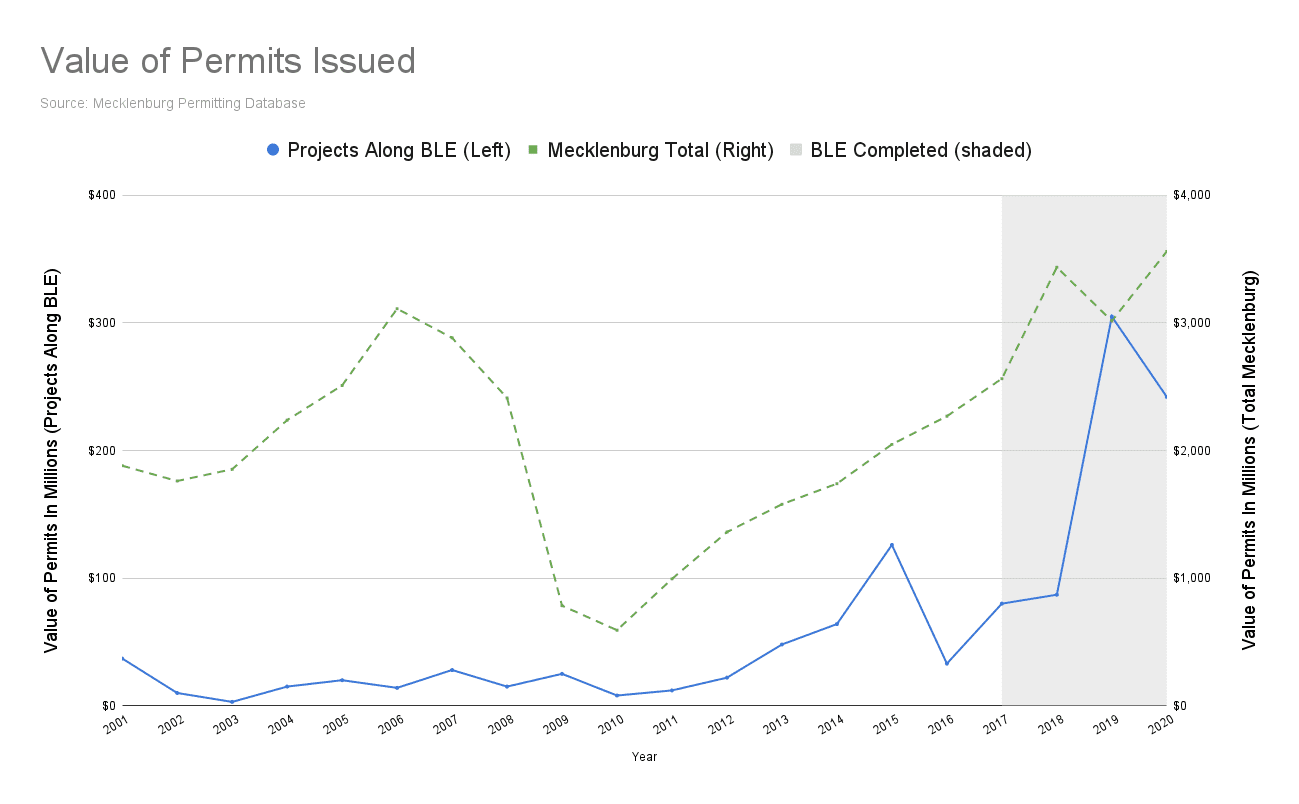
- From 2001 to 2012, construction spending averaged about $20 million per year along the area where the Blue Line Extension would run , representing a tiny fraction of the city’s overall construction.
- In 2013, the year workers began on the 9.3 mile long Blue Line Extension, construction spending increased to $48 million — more than double the average for the previous years.
- But 2019 was a record year, totalling $305 million in investment. Several factors could explain this spike, including increasing demand for higher density uses from developers, low interest rates and a strong rental market.
- In total, since 2013, there has been nearly $1 billion in new development along the BLE.
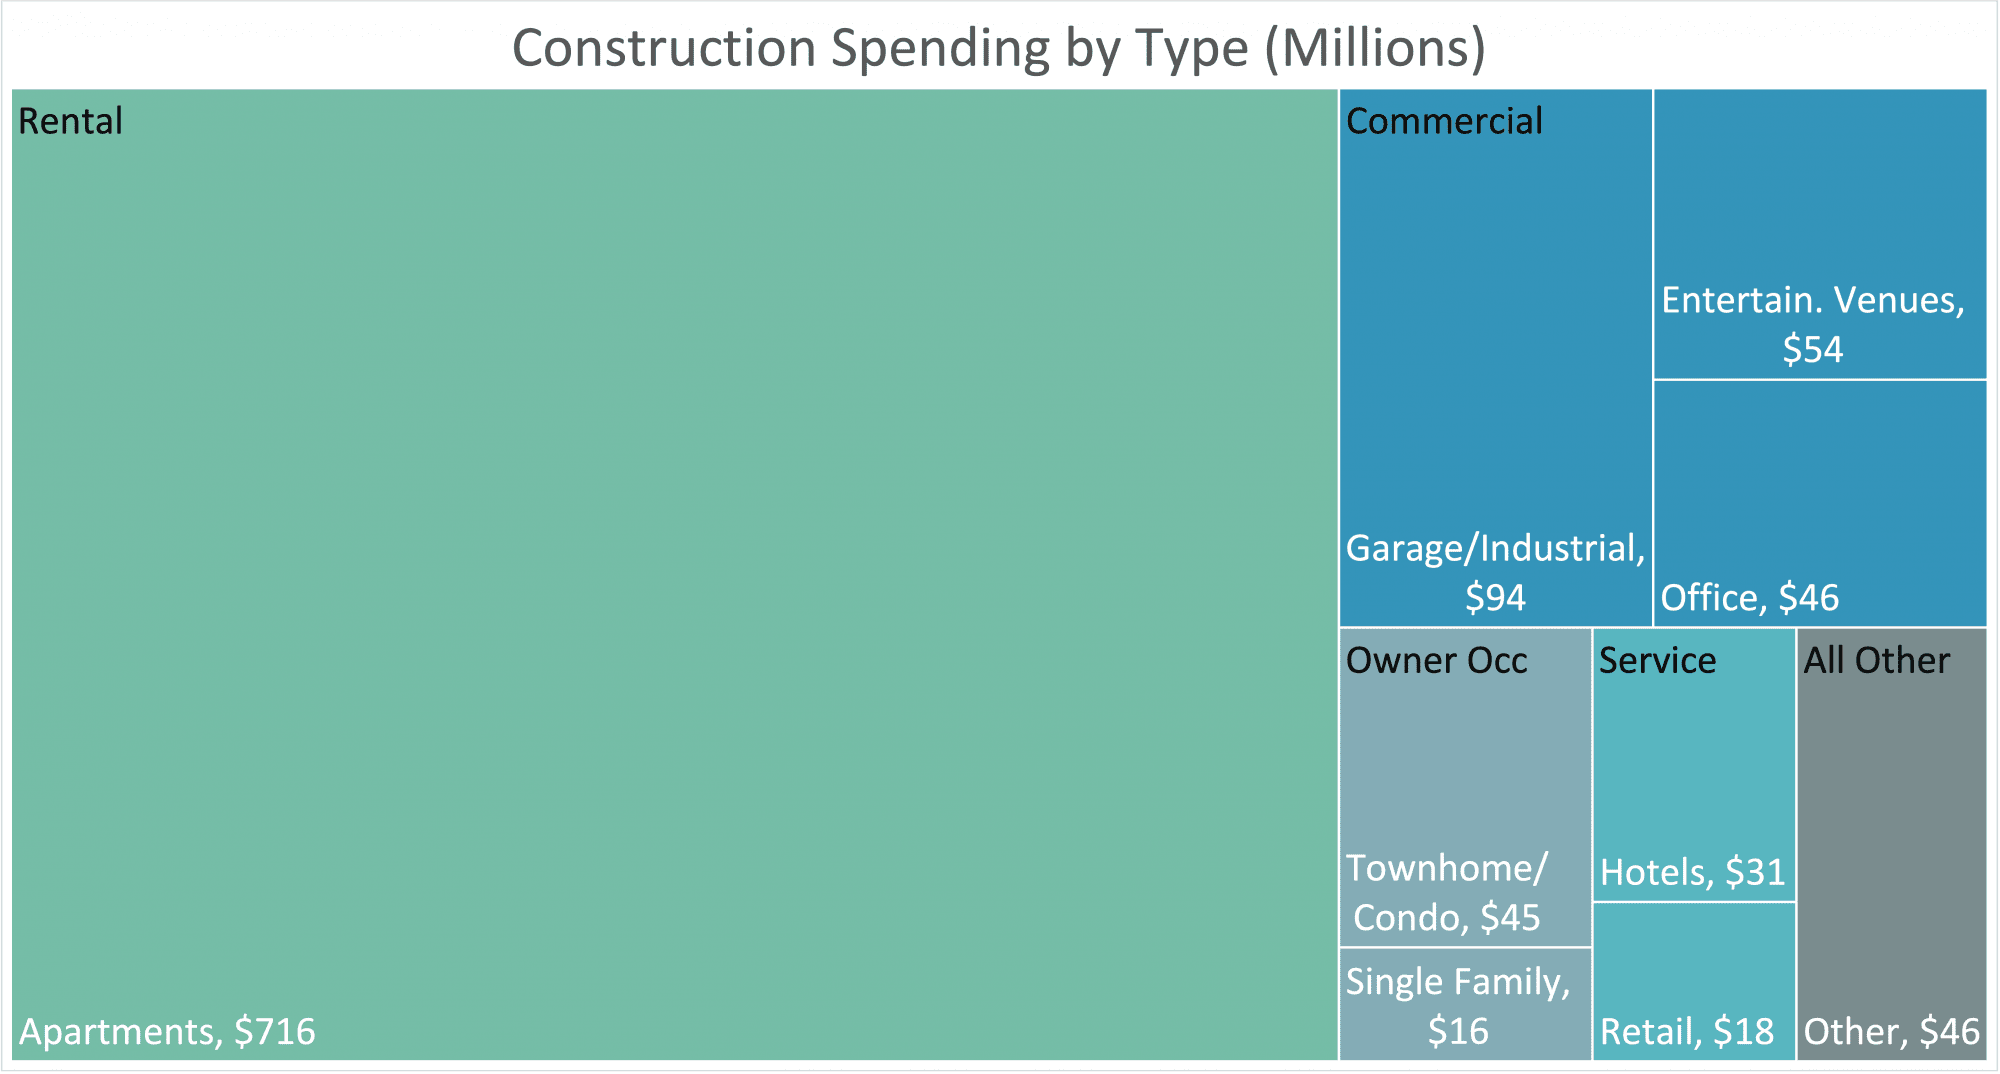
- Between 2013 and 2020, apartment buildings accounted for two-thirds of construction spending along the Blue Line Extension, followed by offices and parking garages.
- Countywide, 2020 was a record year for construction spending in Mecklenburg, totaling about $3.6 billion.
Countywide, construction has remained strong too. Despite record levels of unemployment and a sharp decline in GDP during the pandemic, construction spending was largely untouched.
While data shows the clear rise in construction spending, this study doesn’t tell us what construction would have been like without the BLE. Even in the absence of a train, NoDa and the University area would no doubt still be popular places to live and work. More complex analysis is needed to estimate the net gain in construction spending had the BLE not been built.
Types of construction
The data shows that there is a wide range of development types along the line. Entertainment venues, like Top Golf, have found a home near the light rail. New restaurants and breweries have popped up nearby, like Divine Barrel and the Broken Spoke.
There have been 331 demolitions recorded along the BLE since 2013. Many were aging, outmoded ranch houses typical of the WWII-era suburban boom.
Not surprisingly, demolitions have become a common occurrence around Charlotte. Thousands of homes and businesses have been torn down to make way for new development in recent years.
Construction spending along the light rail is concentrated in specific areas. The area along the BLE just outside of Uptown has experienced a surge in construction projects — not a surprise, given its proximity to the center city, historic buildings and walkable streets.
The map below shows large projects ($1 million or more) as dark green. Larger projects have concentrated along the light rail, partially because of the demand by developers, but also because transit-oriented zoning allows for higher density projects.
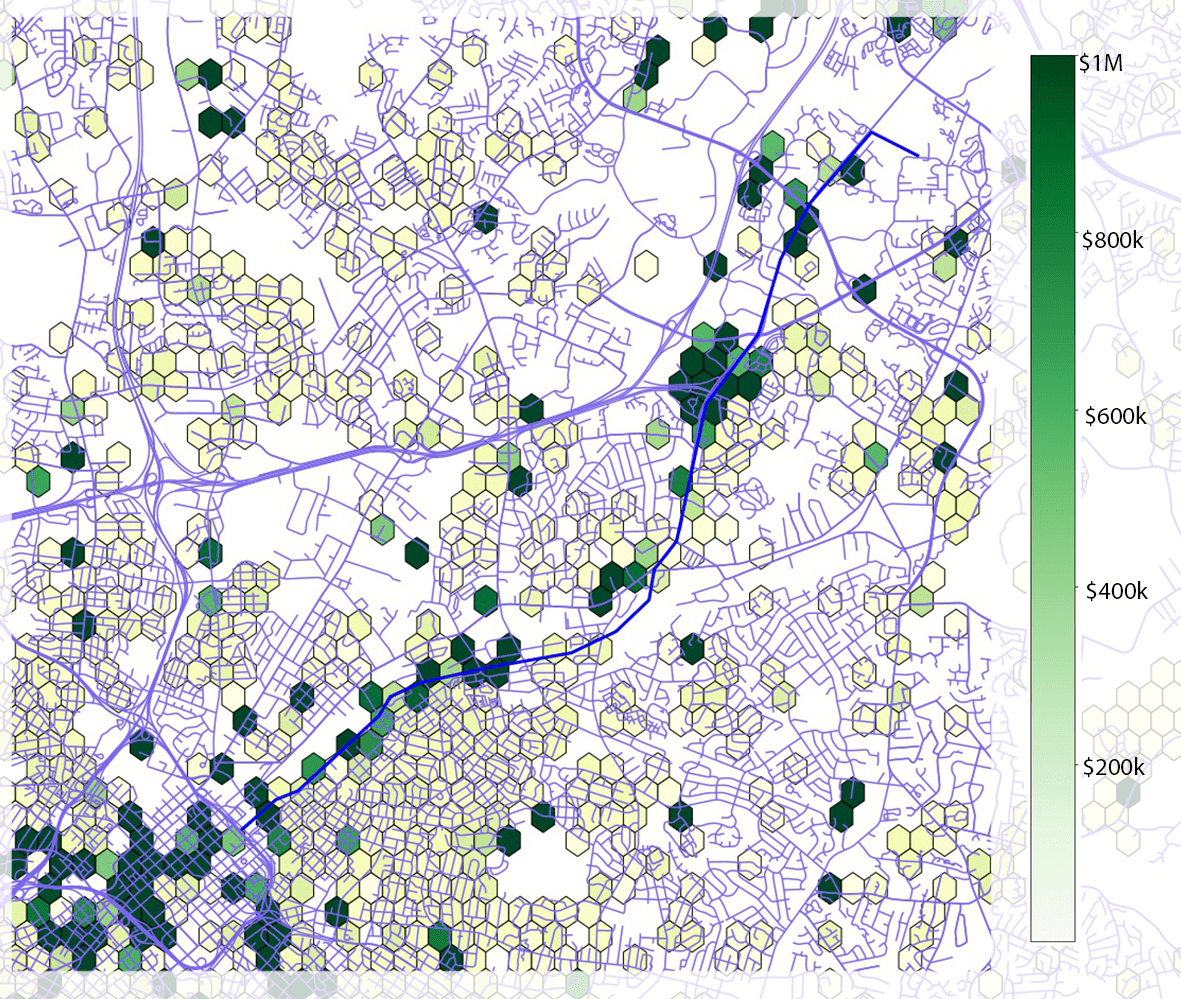
Hexbin plot showing total value of new construction spending on the north east side of Charlotte since 2016. Shaded blue line represents the Blue Line Extension. Construction is concentrated in Uptown and along the new light rail line to the University Area. The dark green bins show the heaviest concentration of spending. Smaller projects, shown as a light yellow, are mostly single family construction or small remodel projects. Note where construction is not happening. Many homes in Belmont, near NoDa and the Plaza are being torn down or renovated. But just outside of the most popular areas, very little investment is occurring currently.
Housing
Most of the residential construction along the BLE is apartments, but all different types of housing have been built along the light rail recently. Here are some of the key findings about housing:
- The number of residential permits, including single family, townhomes and apartments, increased by nearly 400% from 2018 to 2019.
- In 2020, just over 1,600 new residential units were built.
- Nearly 7,400 units have been built since 2013.
- But all of that growth is dependent on a few large scale projects. Just four apartment buildings in NoDa added the majority of new housing units along the BLE in 2019. Alta Warp and Weft, The Parwood at Optimist Park, The Collective and Bainbridge NoDa added a total of 1,253 units.
- In 2021, though, the pace may be slowing down — only 170 residential units have been permitted along the line as of June.
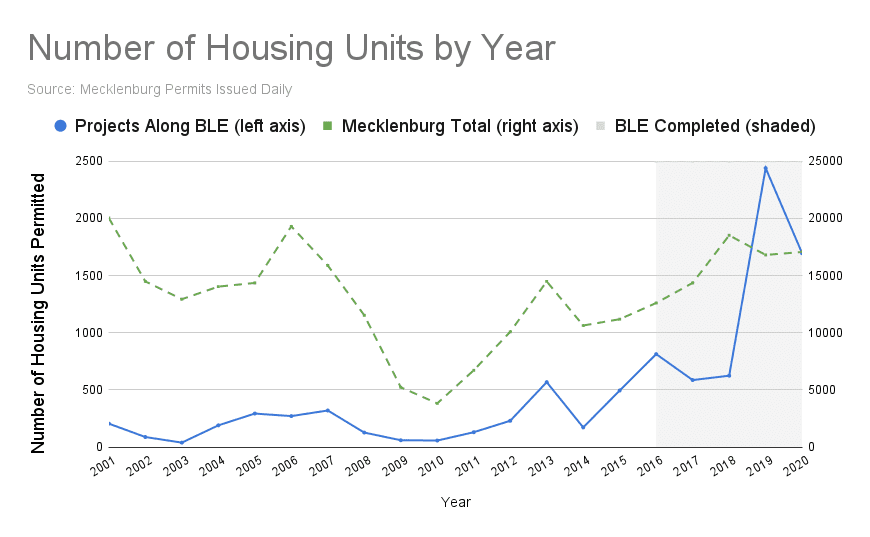
Despite the growth in housing development along the BLE, these homes account for just a fraction of overall housing construction in Mecklenburg County. In Mecklenburg last year, 16,000 new housing units were built,
compared to 1,600 along the BLE.
Since the financial crisis in 2008, apartments made up the majority of new housing construction in Mecklenburg. But 2019 marked a shift. Now more single family homes — attached or detached — were built than apartment units. As of June 2021, only 42% of new housing units were apartments.
Part 2 of this series looks at the relationship between transit oriented design and new development patterns, and discusses how better urban design can create more transit ridership.
Nathan Griffin earned a master’s degree in economics from UNC Charlotte in 2018 and a bachelor’s degree in business management from Pfeiffer University in 2016. He works as a project developer at Trane Technologies where he is involved in commercial construction projects. He also is an Adjunct Instructor of Economics at Central Piedmont Community College.
Nathan Griffin