Poverty Rates Decline in Charlotte Region

By Katie Zager
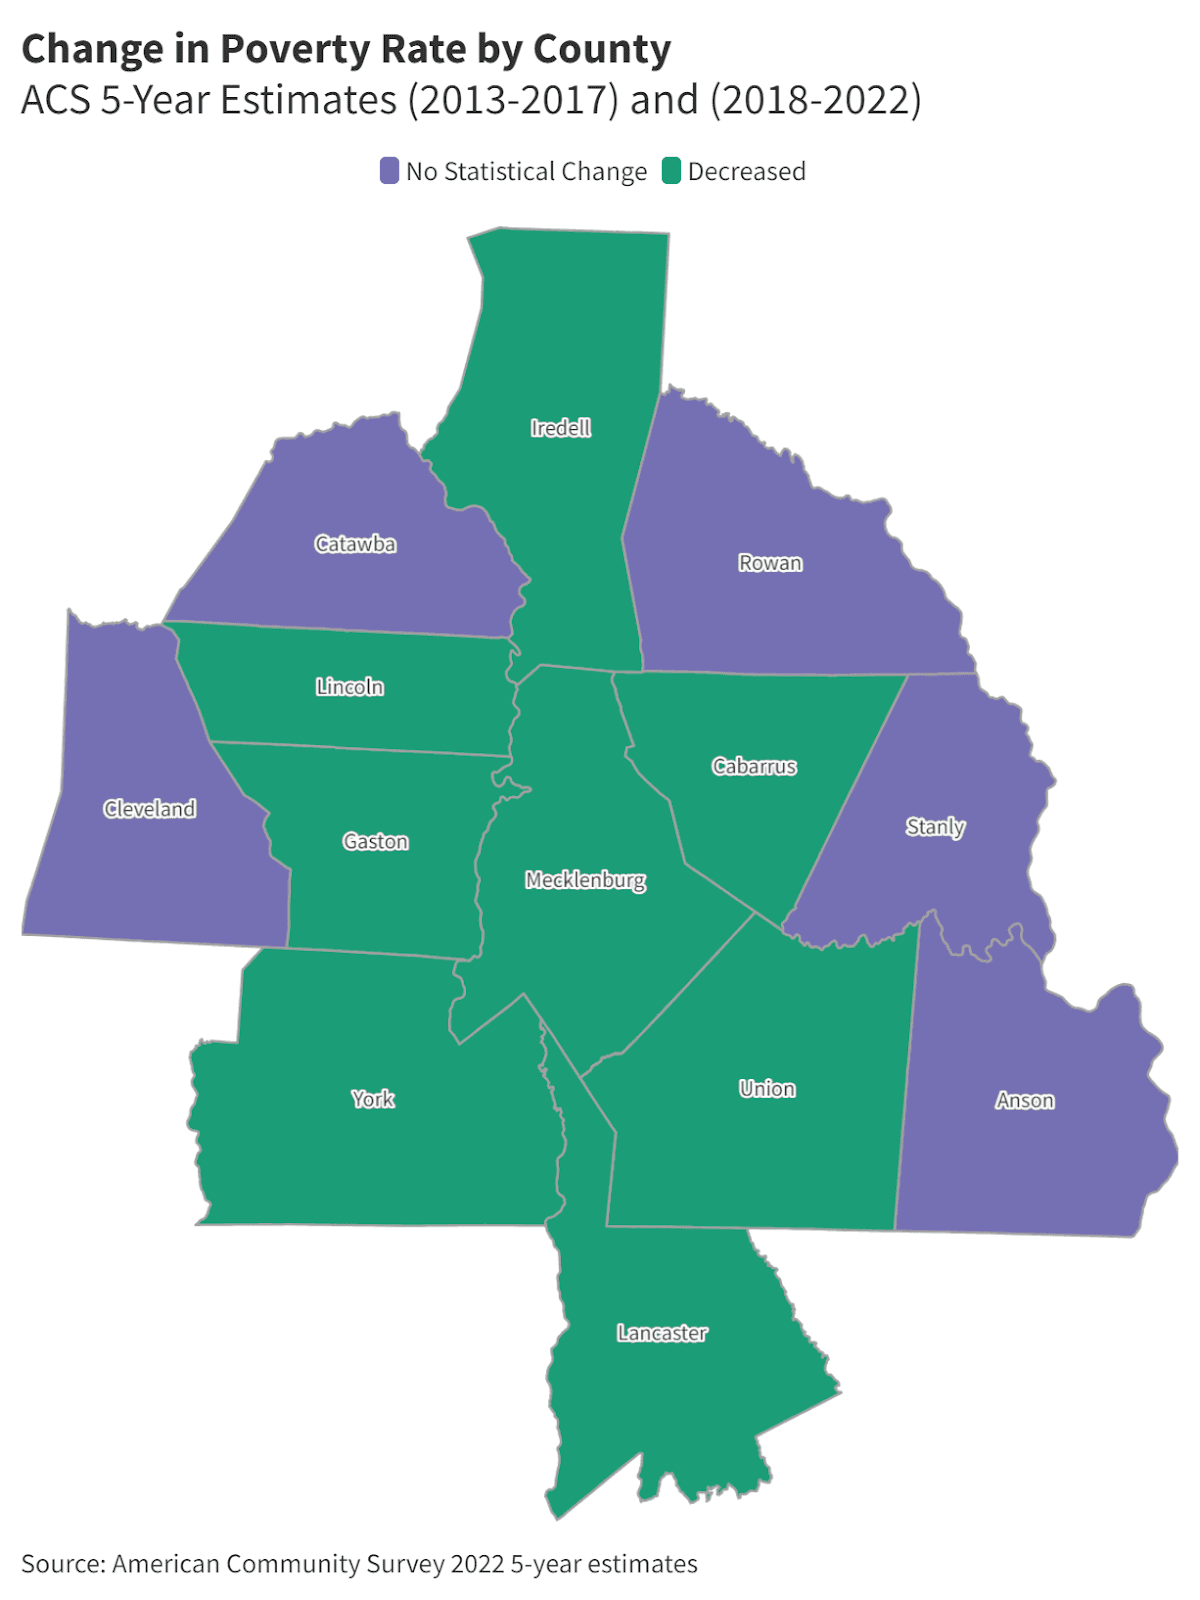
New data from the American Community Survey(ACS) shows that poverty rates have decreased in Charlotte and surrounding areas. Among the 14 counties in the region, eight (60%) saw a statistically significant decrease in poverty. The region performed better than the nation as a whole, where about 36% of counties had a significant change in poverty rates.
5-year estimates allow us to measure poverty in low-population counties
The American Community Survey combines data averaged over five years to provide more stable estimates of income, poverty, and other socioeconomic indicators. The data here shows the poverty rate from the five-year period between 2018 and 2022, and includes areas with smaller populations such as Anson County (population 22,000).
The ACS measures poverty by comparing family and individual income, which includes earnings and cash benefits, to a set poverty threshold based on family size and income. In 2022, the threshold was $15,225 for an individual under the age of 65, up from $11,756 in 2017. The threshold is nationwide, and does not account for cost of living. (view interactive map here)


Poverty rates in the region range from about seven to twenty percent. Union County has the lowest poverty rate, at 6.9%, while Anson County has the highest, at 19.3%. Cleveland and Chester Counties fall close behind, both with rates over 18%. Among the 14 countries, the average county rate was 12.7 percent.
The poverty rate has meaningfully decreased in the past 5 years
Almost two-thirds of the counties in the region saw a statistically significant decrease in poverty compared to the last five-year estimate, which covers 2013 to 2017. Among those counties, poverty rates decreased by an average of 3.65%. Lincoln county had the largest decrease, at 5.9%, followed by Gaston County, at 4.1 percent.
This is a much different pattern than the one seen in the prior decade. Comparing estimates for 2008-2012 and 2013-2017, shows that only two counties, Mecklenburg and Lancaster, saw a decrease in poverty rates. (view interactive map here)
Over the past 10 years, only two counties, Anson and Stanly, saw little or no change in poverty rates. The methodology used here makes it harder to detect change in lower-population counties. However, some counties, such as Scotland, which is very similar in size and demographics to Anson, did see a statistically significant decrease in poverty.
Rising incomes, changing populations
Census data shows that median household incomes have increased significantly since 2017.
Looking at ACS data, among counties in the region, the average county’s nominal median household income increased from $49,603 to $67,407.
One distinct pattern in this region is that all of the counties that had a statistically significant decrease in poverty rate are adjacent to Mecklenburg County. There are likely spillover effects from increased urbanization and population growth that are also contributing to lower rates of poverty, such as:
- Newcomers to these counties might have higher incomes than the people already living there, thus decreasing the poverty rate
- Nominal median household incomes in these counties increased on average 37% between 2017 and 2022, compared to 29% for counties that did not see a change in poverty rates
Nationally, urban, rural, and suburban counties alike saw decreases in poverty. However, one-year ACS data suggests that income growth is slowing or decreasing nationally. Decreasing household incomes or lower wages could send more families back into poverty in the future.
Decreasing poverty rates are by and large a good thing, however they don’t tell the whole story; income distribution matters as well. While lower poverty rates in a county are indicative of economic improvement, the abundant research on social and economic mobility shows, it takes work to make sure a rising tide lifts all boats.