Quality of Life Explorer Timeline
By Katie Zager
Although we are celebrating the 10th anniversary of the Quality of Life Explorer, the history of Quality of Life in Charlotte actually goes back more than 25 years. Below is a brief timeline of the development of the Quality of Life project in Charlotte.
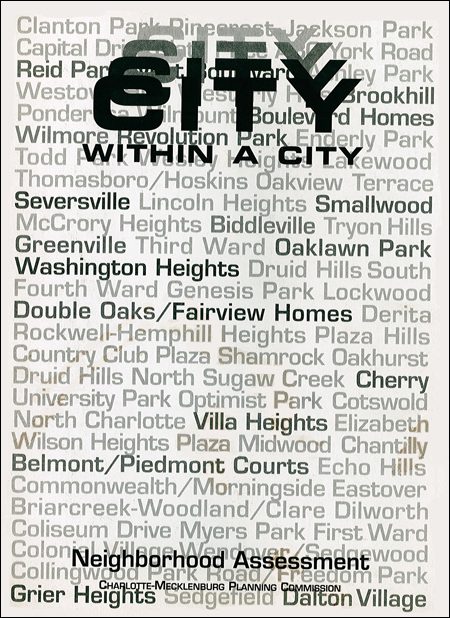
1993: Charlotte Mecklenburg Planning Commission Identifies City Within A City neighborhoods
According to a 2013 Urban Institute interview with Dr. Owen Furuseth, Professor Emeritus of Geography at UNC Charlotte and former Associate Provost of Metropolitan Studies and Extended Academic Programs at UNC Charlotte (the Urban Institute’s parent unit at the time), “the city recognized that if Charlotte was going to prosper as a city, its inner-city neighborhoods needed to be healthy – socially, economically, and demographically. The Charlotte-Mecklenburg Planning Commission identified what it called the “city within a city,” 73 neighborhoods within a 3-mile radius from the intersection of Trade and Tryon uptown. The City Within A City (CWAC) neighborhoods were very eclectic; they were the old silk-stocking neighborhoods of Eastover and Myers Park and some up-and-coming ones like Plaza Midwood, Elizabeth and Dilworth, and traditional, historically African-American and low-income neighborhoods on the west, north and south side: Beatties Ford Road, Cherry and Biddleville, places like that.”
The first set of metrics consisted primarily of US Census data, paired with local, administrative data from places like the police department or social services. The use of administrative data was particularly important at the time because data from places like the U.S Census Bureau were only collected every 10 years.
1997: Formal City Within A City Study Created
According to Furuseth, they looked to projects in cities like Seattle, Portland, and Toronto to create a list of indicators that would be feasible for a study like this, keeping only those felt relevant to Charlotte. After a series of public meetings, they ended up with a list of 27 or 28 variables in the categories of ‘physical,’ ‘crime,’ ‘social,’ and ‘economic.’
One component of the study was to combine and weight variables into a single composite measure, so neighborhoods could be compared across time and space. The neighborhoods were ranked and color-coded to show where they fell in relation to other neighborhoods.
2000: City Within A City Expanded to all 173 Charlotte Neighborhoods, creating the Charlotte Quality of Life Study
In 2000, the CWAC study went city-wide, and the variables were dropped to 20, which was more efficient to collect. The Quality of Life Study continued as a printed report, consisting of several hundred pages, and was released bi-annually. These reports were published by the City of Charlotte from 2000 to 2010.
2010-2012: Development of the Charlotte Mecklenburg Quality of Life Explorer
Under the leadership of Dr. Furuseth, researchers at UNC Charlotte, in partnership with the city of Charlotte, and Mecklenburg County, began work developing the next generation of Quality of Life study. Several important changes were made, the first being the decision to release the indicators as an online dashboard, the Quality of Life Explorer. The Quality of Life study was also expanded to encompass 462 neighborhoods in Mecklenburg County, including the towns of Davidson, Cornelius, Huntersville, Matthews, Mint Hill and Pineville. And the list of indicators increased, from 20 to 80.
This expansion was possible for two reasons. First, the support of the Tobin Bradley of Mecklenburg County GIS, who developed and continues to maintain the dashboard platform.
The second reason was the release of the American Community Survey, a U.S. Census Bureau program that is able to provide more frequent data estimates describing many of the demographic, social, and economic conditions of Mecklenburg County neighborhoods.
The release of the 2010 American Community Survey meant that neighborhood boundaries had to change in order to be compatible with this new data source. A series of public meetings were held early in the Quality of Life Explorer development process to determine what the neighborhood boundaries should be. The resulting geography are called Neighborhood Profile Areas (NPA’s), and consist of one or more census block groups. The Quality of Life Explorer also uses NPA numbers, rather than names, to refer to neighborhoods, due to the sheer number of areas. We can also see from the old CWAC list, that neighborhood names can change over time.
A series of focus groups were held with community organizations, city and county departments, town staff, and community to determine what data was available and what the indicators should be. The Quality of Life Explorer was able to include administrative data from the towns around things like nuisance violations and board/committee participation, countywide data around educational outcomes and health, and environmental data, such as tree canopy.
Finally, the philosophy behind Quality of Life slightly changed. The dashboard platform allows people to explore and decide for themselves what ‘Quality of Life’ means, and which indicators are most important. The old weighting and ranking system was dropped. Instead, data were organized around nine dimensions: Character, Economy, Education, Engagement, Environment, Health, Housing, Safety and Transportation.
2013: Quality of Life Explorer released to public
In early 2013, the Quality of Life Explorer was released to the public. Tobin Bradley made all of the code available to the public, which cities like Durham have used to create their own indicator projects.
Over the years, a few tweaks have been made to the Quality of Life Explorer. One important feature gives users the ability to select multiple NPA’s to create their own neighborhood. This allows Charlotte City Council Members and Mecklenburg County Commissioners to easily see what is happening in their districts, but also allows flexibility for any user to define what they consider to be their community.
2014: Membership in NNIP
In 2014, ‘Charlotte,’ consisting of the city, county, and UNC Charlotte Urban Institute became partners in the National Neighborhood Indicators Partnership (NNIP), hosted by the Urban Institute in Washington DC. NNIP consists of partners who assemble and transform local administrative data, apply data to achieve impact, and build community capacity, thus enabling people to access and use data to inform efforts to understand outcomes and improve outcomes where they live. The Quality of Life Explorer is a central part of how Charlotte fulfills this mission, and the partnership has been a valuable tool both for sharing our accomplishments, and learning from peer organizations.
2022 and Beyond: The past few years, the QOL team has been working on improving their data processing capabilities and the pipeline that feeds the Quality of Life Explorer. A future article will discuss what those improvements mean for users of this valuable tool.