Smart metros: Charlotte and North Carolina

Charlotte’s metro has one of the fastest-growing college-educated populations in the U.S. Where exactly do the educated live in Charlotte? As people with college degrees cluster in metros, what does that mean for rural areas?
The number of college-educated adults exceeds 40 percent of the working population in just a handfull of counties across the country. Mecklenburg County, home to Charlotte, is an example of one of these highly educated counties (read more). Populations within counties are not homogenous, however, and metropolitan patterns do not stop at county lines.
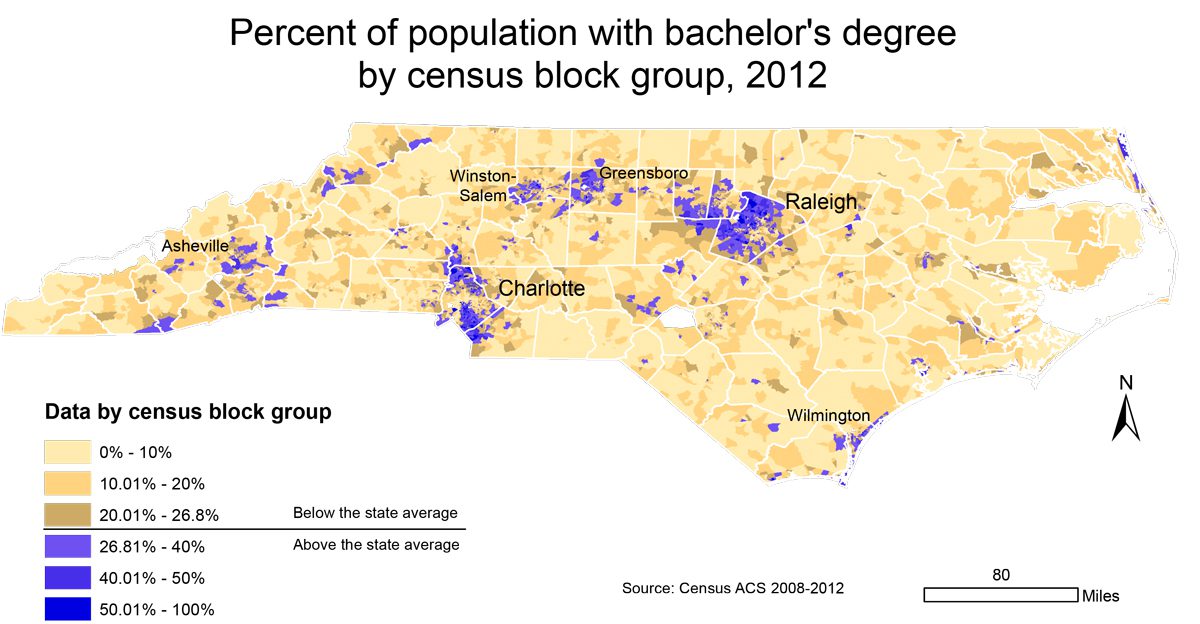
In North Carolina’s metros areas, college-educated populations occur in very specific, and very concentrated patterns. The map below shows these concentrations in Charlotte, Raleigh and a few other cities and retirement-friendly areas in the state.
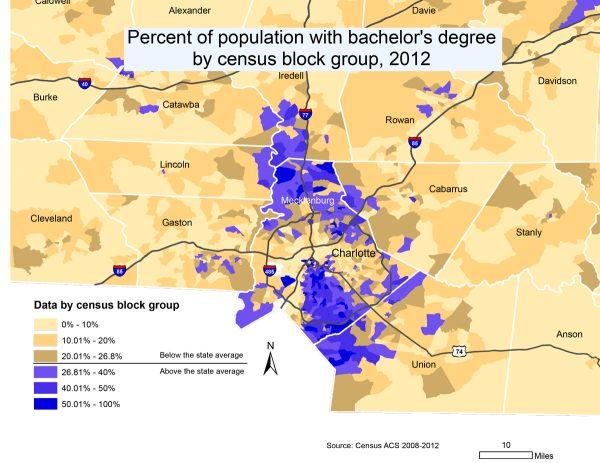
To see this more fine-grained pattern, the map shows the percentage of population with a college degree at the census block group level.* Block groups are quite small compared to counties, allowing for this more geographically realistic representation. At this level, the largest concentration of college-educated population is clear in Raleigh and the adjoining Durham and Chapel Hill area to the west. Charlotte shows a strong concentration north and south of the center city.
Since Charlotte and Raleigh’s home counties have both large populations and large college-educated populations, these two counties push the state-wide education average up. The result is an even more stark contrast between these areas of higher educational levels and the rest of the state. This is not a unique pattern. Nationally, more educated populations are clustering in metro areas and have been for some time.
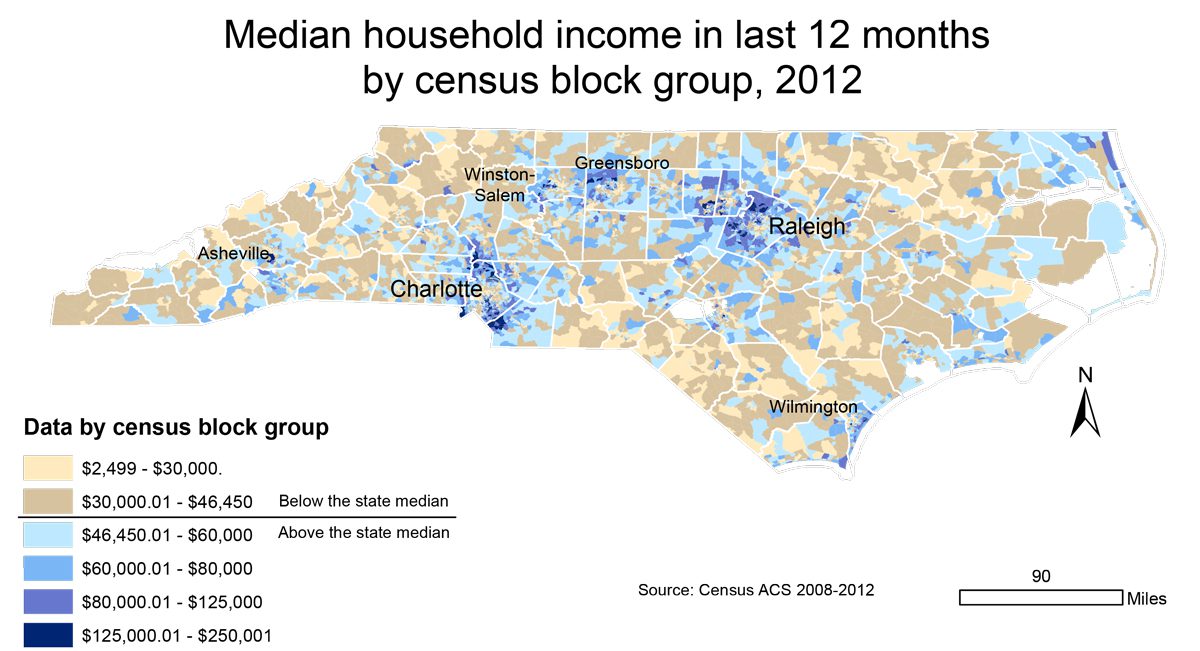
Taking a closer look at the Charlotte area (maps below) shows the clear geographical relationship between education levels, income and poverty. The top map in the set below shows the median income. While the highest income levels correspond closely with the highest education areas, incomes above the state median are not quiet as concentrated as the college-educated population. Higher incomes are spread more widely around Charlotte in a suburban ring that surrounds the region fairly evenly.
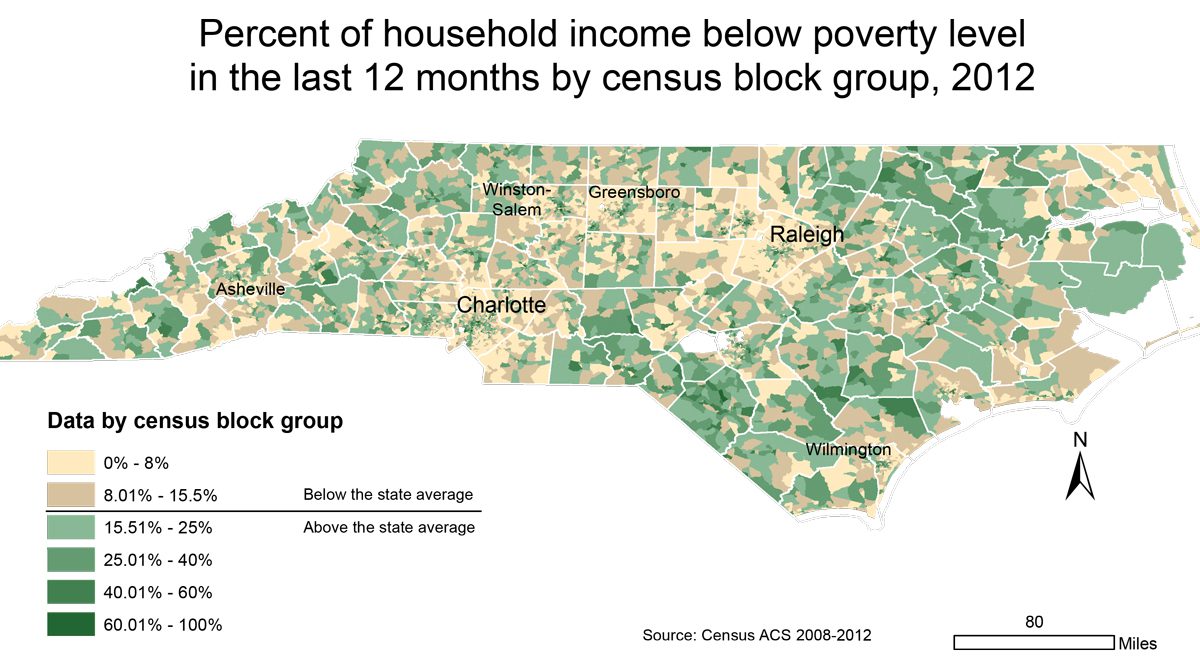
This income pattern corresponds with a zone of low poverty that wraps around Charlotte and contrasts with areas of higher poverty that occur both in rural areas on the fringe of the metro and in an arc across the northern central parts of Charlotte (poverty map for the state is below).
The rise in rural poverty during the recession has been widely covered as a national phenomenon. Along with this rising rural poverty, a new pattern in North Carolina since 2010 has been declining populations in many rural areas, most of which saw at least moderate increases through the 2000s.
The statewide map of income below shows the effect of the metro regions. Large areas in and around Charlotte and Raleigh are above the median, while the areas farthest from any of the larger metro areas typically showing the lowest income.
The map showing poverty by block group (below) shows a nearly mirrored pattern to income, as expected, but the zones of higher poverty areas are clearer within urban centers. Keep in mind that these smaller, but denser patterns of block groups represent larger populations than the larger block group zones in the rural areas (view PDFs to see the pattern more clearly).
These maps highlight two public policy concerns:
- Rural areas outside of the metropolitan zones of population growth and economic activity face lower levels of education and income and higher levels of poverty. This is not unlike other rural areas nationally, but North Carolina is late coming into this transition, and many rural areas of the state are beginning to see declining population since 2010 (for more information click here).
- Urban cores areas across the state contain significant populations of lower income and education. (Read recent report that found a majority of the people living in distressed areas in the state were in metropolitan regions.)
As global trends continue to reinforce clustering of educated populations and economic activity in metropolitan areas, challenges will persist in dealing with the effects on both rural and urban areas. Population densities, access to resources, demographics and culture all call for different strategies when addressing urban and rural areas.
Urban cores may have some advantage by being in the center of economic activity and growth in the state, but the number of persons affected by these issues in urban areas is larger and more concentrated. Rural areas do not typically suffer from the added issues associated with concentrations of poverty, but isolation and declining populations in these areas are major concerns.
The geography of educational attainment offers a better understanding of the issues of income and poverty. These maps make it clear that clustering among educated populations has already resulted in stark contrasts within and between cities and regions of the state.
*Data for maps are from the census ACS 5-year estimates for 2008-2012. These estimates are based on survey samples and represent the average characteristics of population and housing over the period of data collection. For more information on accuracy of these data.


