Maps

Explore local housing data with new interactive maps
We often paint Charlotte’s housing market in broad strokes: rising prices, bidding wars and gentrification reshaping neighborhoods. Updated data on the Charlotte/Mecklenburg Quality of Life Explorer lets you can dig deeper into the story told by those aggregate numbers. Charlotte’s neighborhoods are starkly different when it comes to characteristics such as what percentage of homes […]
Explore everything from residential segregation to how much trash you generate with new maps
Which parts of Charlotte use the most water? Where is our growth eating up whatever vacant land is left in Mecklenburg County? Where are the racial, economic and other dividing lines that crisscross our community? You can answer these questions and more with the updated Quality of Life Explorer maps published online today. A joint […]

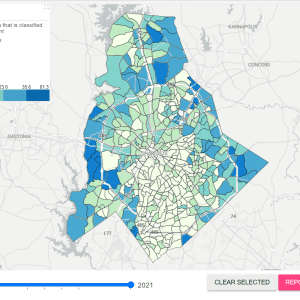
Updated maps let you explore Charlotte’s changing housing
Which Charlotte neighborhoods have gotten denser, with more residences per acre? Where have average home sizes ballooned? Is the proportion of single-family homes rising or falling in neighborhoods where new apartments and tear-downs vie for space? Newly updated maps on the Charlotte-Mecklenburg Quality of Life Explorer allow you to probe these questions and visualize changes […]
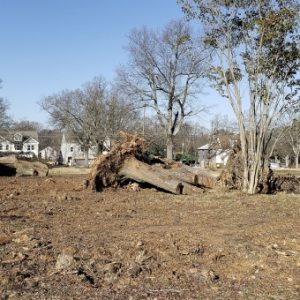
Charlotte’s losing its green canopy, despite efforts to save trees
Charlotte is losing over three football fields a day worth of trees. That’s the sobering conclusion of a study by the University of Vermont in collaboration with TreesCharlotte, detailing how development, age, storms and other factors have cut down Charlotte’s tree canopy. The percentage of Charlotte covered by tree canopy fell from 49% to 45% […]

Five maps that show stark health disparities in Mecklenburg County
Sharp differences in race and income are visible on a map of Mecklenburg County, generally in the familiar “crescent and wedge” pattern many Charlotteans are familiar with. For example, check out the divisions on this map of household income: But differences are also available in other, more unexpected dimensions as well. These five maps illustrate […]

How prevalent is multifamily throughout the Charlotte region?
The old planners’ joke is that Americans hate two things for their cities—urban sprawl and high density. The joke, of course, is that developing at low densities, such as one house per acre or half acre, spreads the same amount of housing across more acreage—in other words, sprawl. Higher-density development—typically multifamily—has been a topic of […]

Charlotte’s I-485 lures growth, and with growth comes traffic
With the final leg of I-485 opening in June, motorists cheered the new, unclogged lanes. But if the past is prologue, eventually new development nearby will bring congestion. Across the United States, it’s always the same story with the same ending: a loop highway is built around a growing city. It provides traffic relief for […]
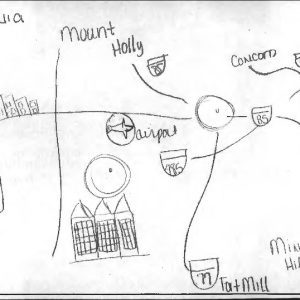
Mapping Charlotte in your mind
Each of us has a different image in our minds of what constitutes a place. Is it the road network? The buildings? The people? One UNC Charlotte geography professor has been asking students on the first day of class to draw a map of Charlotte. He doesn’t tell them what type of map, or even […]
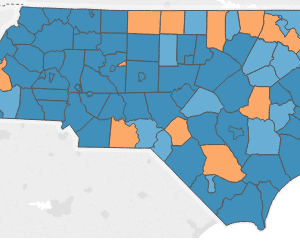
Annual measurable targets by district, 2013-2014
This week’s map looks at the school districts that met annual measurable objectives (AMOs) across the state. AMOs are a series of performance targets that state, school districts and schools must meet on designated assessments and indicators for specific subgroups of students annually to meet the requirements of the Elementary and Secondary Education Act (ESEA) […]
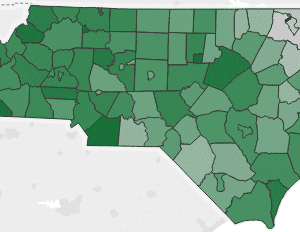
Mapping N.C. student overall proficiency by district, 2013-14
This week’s map looks at the newest proficiency data for school districts for end-of-grade (EOG) and end-of-course (EOC) exams. EOG proficiency rates reflect the share of all end-of-grade tests taken (3rd-8th for reading and math, 5th-8th for science) that were scored proficient. EOC proficiency rates are the percent of all end-of-course tests taken (in Math […]