Has Charlotte metro income really declined?

Recently the site FiveThirtyEight.com reported that of the largest U.S. metros, only Charlotte’s median income, “experienced a statistically significant decline” in 2013. What’s going on?
That statement may signal to the casual reader that wages are sinking in the Charlotte region. In reality, however, that “statistically significant decline” appears to be the result of a change in the boundaries of the Charlotte MSA. That change added five counties to the MSA (Metropolitian Statistical Area) that have lower incomes.
Last year, the U.S. Office of Management and Budget released new metropolitan area boundaries based on the 2010 Census. Often, those boundaries do not change significantly between the once-a-decade Census counts, but Charlotte has been growing and changing rapidly. The boundary change, which added several counties to Charlotte’s MSA, added nearly a half-million people.
According to Laura Simmons, director of the Charlotte Regional Indicators project at the UNC Charlotte Urban Institute, “This is the first Census dataset that uses these new boundaries. All previous years’ data, however, are still based on the old definitions and are not recalculated for the updated areas. For Charlotte (and other metros that saw big boundary changes), this means the numbers for 2013 aren’t comparable to those from years past.”
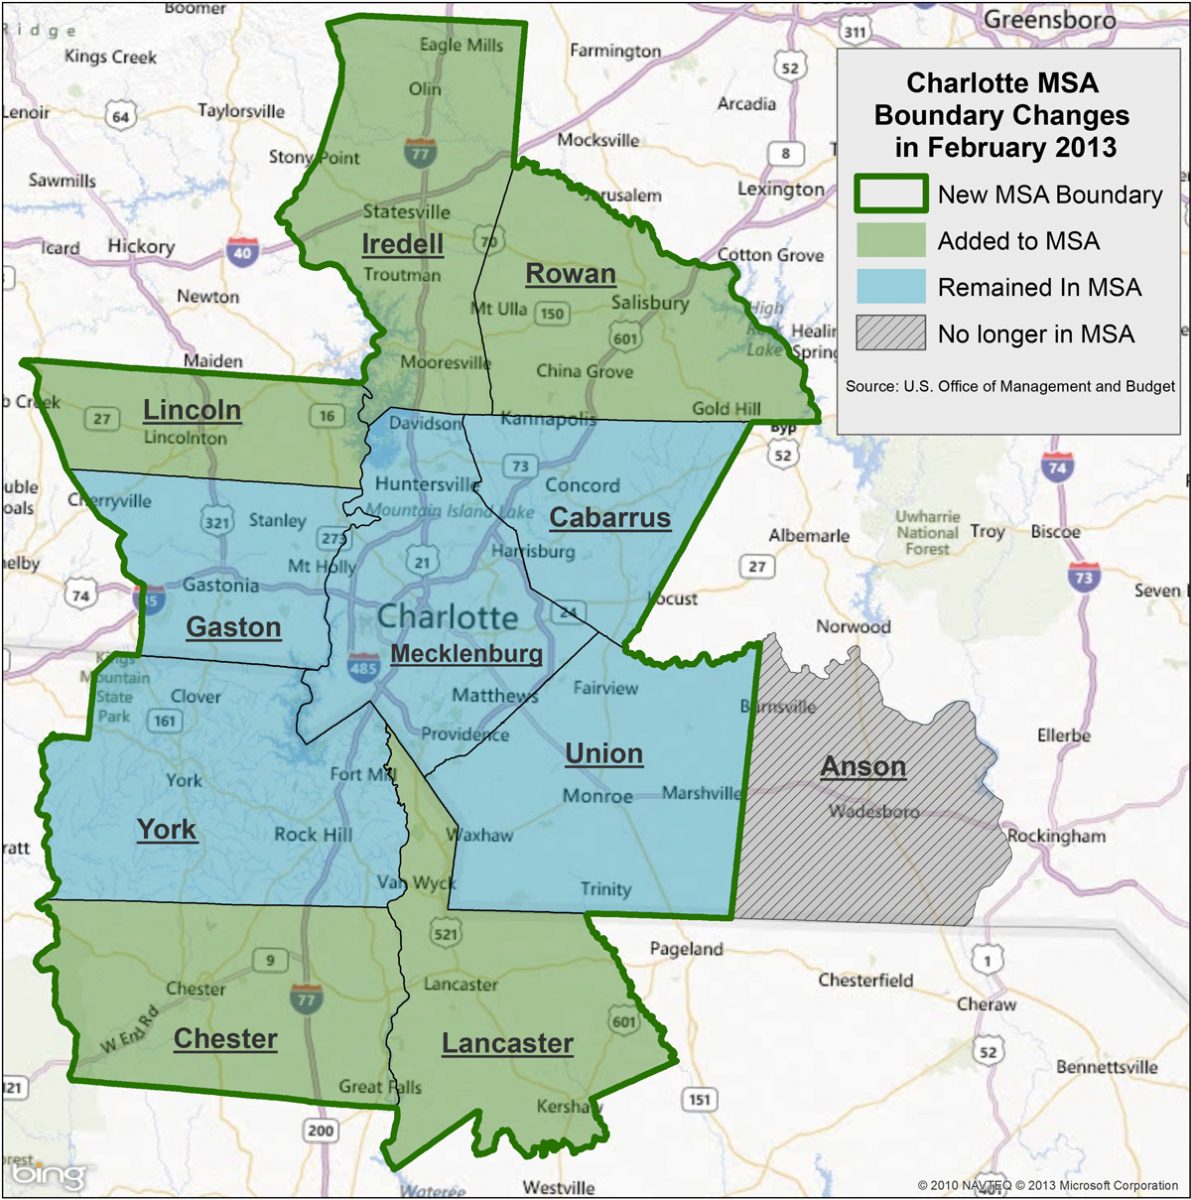
This map (below), from a web post on our site in 2013 shows how much Charlotte’s metro area changed.

Map by Keith Waters. Source: U.S. Office of Management and Budget
The estimates of population from 2012 showed that the boundary change resulted in a population increase from 1.8 million inside the old boundary (highlighted in blue and including Anson County to the east) to a new population estimate of 2.3 million inside the new boundary.
The switch in the reporting of estimates from the old boundary to the new is clear in comparing the 2012 and 2013 American Community Survey one-year population estimates for Charlotte. An example: The population that is age 16 and older increases by more than 400,000, or 28 percent, in one year.
To the Census Bureau’s credit, its website does show this note of caution for comparing these dates:
“The definitions of the metropolitan and micropolitan statistical areas for the 2013 American Community Survey are based on the commuting patterns identified in the 2010 Census. Estimates prior to 2013 are based on the results of the 2000 Census. Statistically significant change from prior years’ estimates could be the result of changes in the metropolitan geographic definitions and not necessarily the demographic, social or economic characteristic. For more information, see: Metropolitan and Micropolitan Statistical Areas.”
Still, the press release from the Census Bureau for the Charlotte area highlights the decline in income that FiveThirtyEight.com picked up.
Now that new boundaries are being used, it is important to understand that prior years’ data cannot always be compared to statistics from the new metro area boundary. Until the next realignment of these metro boundaries after the next census, the best comparisons are those starting with 2013.
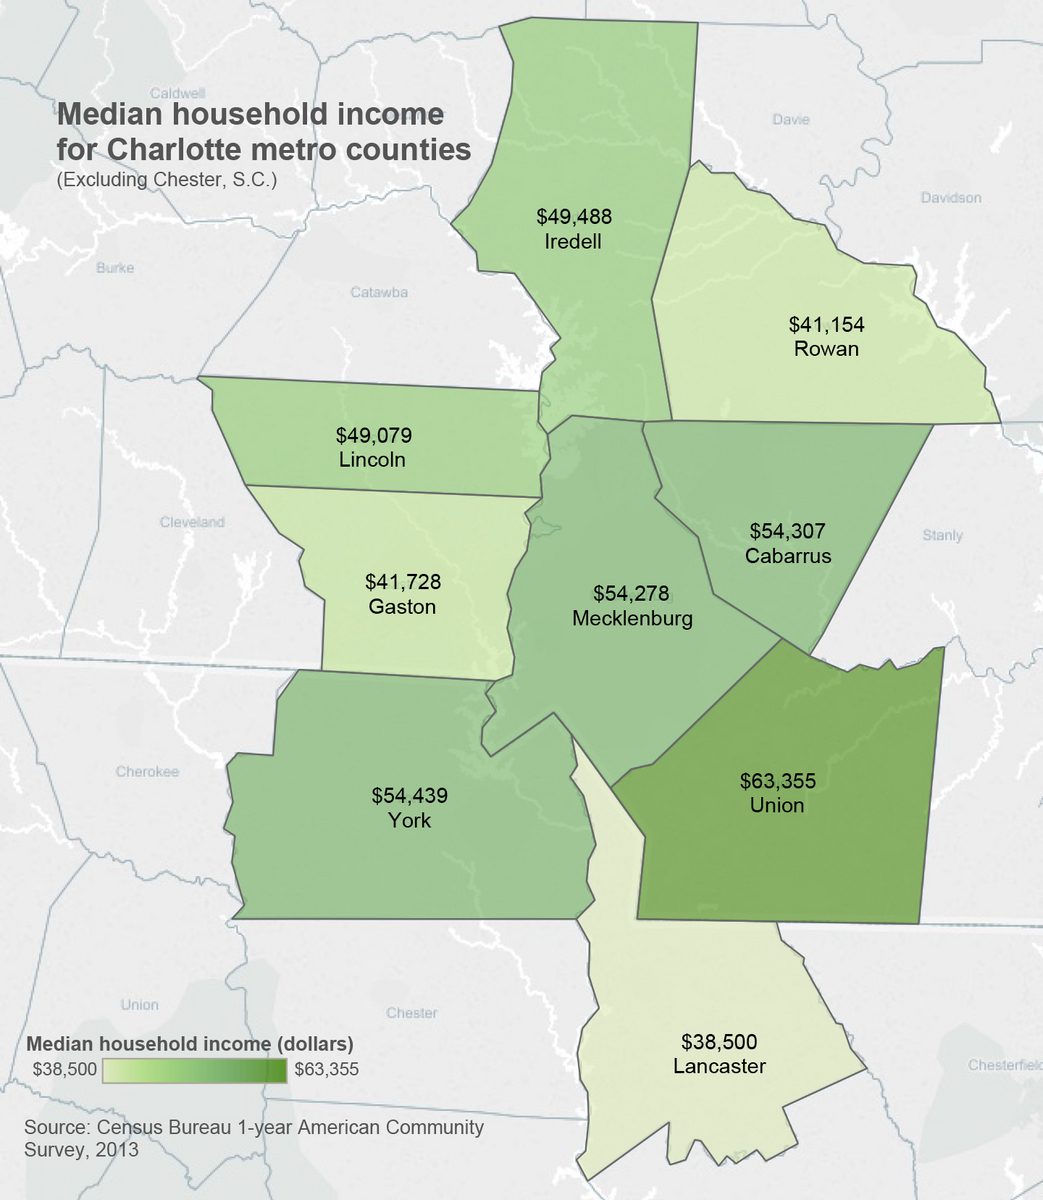
The map below shows median household income for all but one county in the newly defined Charlotte metro. (Chester County, S.C., is part of the new metro area, but its population is below the threshold for one-year estimates at the county level.) The national median income for 2013 is $51,939 (from the Current Population Survey report, September 2014, U.S. Census Bureau). This is not significantly different from the 2012 national median income.
Note that four of the five counties that are in both the old and new MSA boundaries (Mecklenburg, Union, Cabarrus and York) exceed the national median, while all the added counties are below the national median.

Below is a Census Bureau graphic that shows where the newly redefined Charlotte metro falls among the 25 largest metros in median household income. The Office of Management and Budget realigns the metro areas based on commuting patterns and economic ties between counties. The expansion of the Charlotte metro area represents the growing reach of these economic ties. Along with that come more people – and a new demographic profile.
