Data
Social Capital: A Tale of Caution and a Tale of Hope for Charlotte
This article was written by the UNC Charlotte Urban Institute. Data utilized in this series was collected in partnership with Leading on Opportunity, Opportunity Insights, Communities In Schools, YMCA of Greater Charlotte, Foundation For The Carolinas and SHARE Charlotte, and with staff funding from The Gambrell Foundation. To see more results from the 2019 Mecklenburg […]

Housing First Process Evaluation: Many housed, but lessons to learn
Housing First Charlotte-Mecklenburg (HFCM) was launched in 2015 to end chronic homelessness in Charlotte-Mecklenburg by scaling housing first, particularly the housing first permanent supportive housing model. Housing first programs prioritize housing as an early step in service delivery, have low-barrier admissions policies, maximize client choice in housing and services, use a harm reduction approach to […]

Five key findings about the impact of COVID-19 on local renters and prioritizing rental assistance
COVID-19 has had an immediate and potentially lasting impact on the housing stability of low-income renters in Charlotte and the nation. Although the Centers for Disease Control and Prevention recently announced a federal eviction moratorium through the end of 2020, missed rent is not being forgiven. Renters need assistance to avoid often insurmountable back rents […]

Charlotte region’s Hispanic population grows at a rapid pace
Driving down South Boulevard or Central Avenue, it’s easy to see the influence of Hispanic and Latino communities in the shops, taquerias and lavanderias that line both roads. It is perhaps an updated version of the historical image of immigration to the United States, not one of tightly packed tenements and ethnic enclaves in the […]

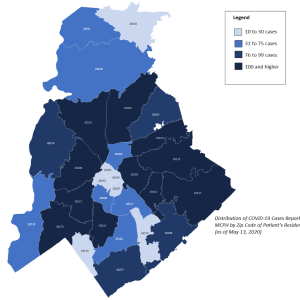
Coronavirus resources: Data, maps and more
The coronavirus pandemic has generated a flood of data, maps and other resources to track the spread — and places to get help — throughout the region. Many of these resources are scattered across different websites and dashboards. Here’s a brief summary of what’s available, collected in one place. We will update this list as […]

The historical roots of the racial wealth gap in Charlotte
This is the second in an ongoing series, based on a report by the Urban Institute. Read Part 1 here. The report was compiled with support from Bank of America, which partners with the UNC Charlotte Urban Institute and the Institute for Social Capital on research that provides insight into community initiatives. Join us each […]

Part 5: Big Data, Big Goals as the Urban Institute turns 50
The UNC Charlotte Urban Institute is marking its 50th anniversary in 2019-20 with a five-part series recalling its history. Sources for these stories include interviews, newspaper articles, university documents and two books – Charlotte and UNC Charlotte: Growing Up Together by Ken Sanford and Dean W. Colvard: Quiet Leader, by Marion A. Ellis. In 2018, […]

New maps show Charlotte demographic trends
New data on the Quality of Life Explorer mapping tool paint a picture of how demographics are changing across Charlotte and Mecklenburg County, as well as other measures such as bicycle friendliness, voter participation and average water consumption. The Quality of Life Explorer is a joint tool of Mecklenburg County, the city of Charlotte and […]

Commuting and the Charlotte region’s economic connections
An array of environmental, cultural and economic connections together give rise to the interdependence of the Carolinas Urban-Rural Connection study region. But none of these connections are more economically significant than the flow of workers within our regional economy. Counties within the region relied on out-of-county commuters for their workforces more in 2015 than at […]

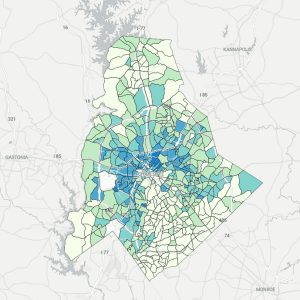
Five maps that show stark health disparities in Mecklenburg County
Sharp differences in race and income are visible on a map of Mecklenburg County, generally in the familiar “crescent and wedge” pattern many Charlotteans are familiar with. For example, check out the divisions on this map of household income: But differences are also available in other, more unexpected dimensions as well. These five maps illustrate […]