Big urban gains, rural losses in the Carolinas
North Carolina continues to grow faster than the U.S. average and faster than all but two other Southeastern states.* That growth is increasingly uneven and concentrated in the metro areas of Charlotte and Raleigh.
The Carolinas have a long history of being a small-town and small-city region of the country. The latest census population estimates show how quickly that is changing. Since 2010, the home counties of Charlotte and Raleigh (Mecklenburg and Wake counties) have grown by an estimated 145,000 people, nearly half of the growth in the state. That is the approximate size of Cary, just outside Raleigh. Ten counties in North Carolina accounted for nearly 80 percent of the state’s increased population in the state.
A large component of this urban growth is being driven by people moving to the state from other parts of the country. Charlotte’s metro is in the top 10 nationally in growth numbers as well as growth percentage from domestic migration. Raleigh’s metro is No. 2 nationally in percentage growth from domestic migration (read more).
These same patterns are occurring nationally. Nearly all the recorded population growth shown by the latest census population estimates occurred in metropolitan areas – with the largest metros claiming a significant share of that growth (read more). By contrast, small towns and rural areas are experiencing population stagnation or declines (read more). In the Carolinas, these declines may be moderate in total numbers, but in areas with relatively low population to begin with, the change can still be dramatic.
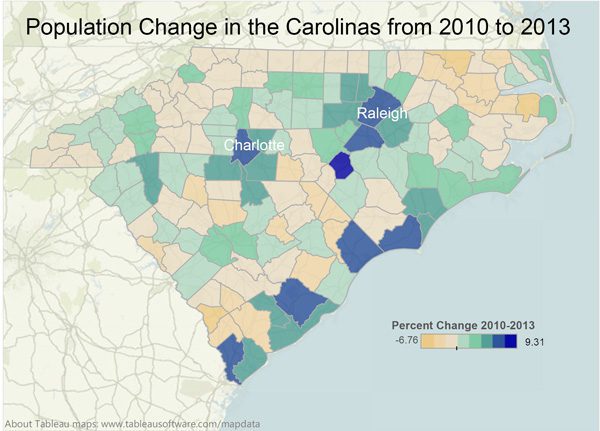
The dashboard below shows the percent change in population in North and South Carolina counties from the 2010 Census to the 2013 population estimates. (Article continues below dashboard.)
<a href=’null’><img alt=’Population Change Map ‘ src=’http://public.tableausoftware.com/static/images/Ce/Census2013NCSC/PopulationChangeMap/1_rss.png’ style=’border: none’ /></a>
Selecting individual counties on the map will highlight the tabular data for those counties (Hold the key down to select multiple counties for your own comparisons.). The columns in the table can also be easily resorted by clicking on the column headings.
In Charlotte’s home county of Mecklenburg, the map shows growth that is faster than the surrounding suburban counties. Read more about this trend.
Another trend the map shows is coastal growth in both Carolinas. The Myrtle Beach region (Horry County, S.C. and Brunswick County, N.C.) is the seventh-fastest-growing metro in the country.
A special case is the surge in growth near Fayetteville in Hoke and Harnett counties. Hoke County, west of Fayetteville, had the highest rate of population growth in either state at 9.3 percent. Growth in this area is related to the federal Base Realignment and Closure Act, which shut 25 major installations and moved large numbers of military and their families to the area.
The interactive graph below shows how disproportionate the growth is among counties. The size of the circles is proportional to the number of people added since 2010. The darker the circle color, the higher that growth rate is, in percentage points, since 2010. You can switch the view in the graph by using the check box to view only North Carolina or South Carolina’s growth counties separately. Hover over the circle to see the name and statistics for that county.
<a href=’null’><img alt=’Growing Counties ‘ src=’http:&#47;&#47;public.tableausoftware.com&#47;static&#47;images&#47;Ce&#47;Census2013NCSC&#47;GrowingCounties&#47;1_rss.png’ style=’border: none’ /></a>Learn About Tableau
Notice that Hoke and Harnett counties in the graph are relatively small, but the darkest color. That indicates they have gained the highest in terms of percentage since 2010, although the total numbers of population gained are not as large as in other counties. Contrast that with Guilford County, the home of Greensboro. The circle is larger than Hoke or Harnett, but the color is lighter, since Guilford grew at a slower rate.
The next interactive graph shows counties in the two states that have lost population since 2010. Half the counties in both states saw some drop in population from 2010 to 2013. While this covers a large area in the states, the losses to these counties total only 38,777 persons, while counties that gained people added 489,844 people (making the net change 451,067). Notice that the circles are all the same size. That reflects that the range of losses is much smaller (3 to 1,762 is the range, compared to 3 to 73,271 for gains).
<a href=’null’><img alt=’Shrinking Counties ‘ src=’http:&#47;&#47;public.tableausoftware.com&#47;static&#47;images&#47;Ce&#47;Census2013NCSC&#47;ShrinkingCounties&#47;1_rss.png’ style=’border: none’ /></a>Learn About Tableau
All these changes reinforce the demographic transition to more urban Carolinas. With continued national migration to the South in general, and Southern cities specifically, we are in the midst of rapid change that does not seem to be letting up. Charlotte and Raleigh are clearly emerging as the focal points for this urbanizing trend in the Carolinas.
As cities become even more critical to regional and state economies, they will also be faced with the infrastructure challenges the rapid growth will bring. How those challenges are met will be crucial to maintaining the health of these engines of economic growth and prosperity.
Rural population losses are a different kind of problem. The forces driving them are global and strong. Declining resources inevitably accompany those kinds of changes – perhaps making these trends even more difficult for policy makers to address.
*All figures in this article are based on change from the 2010 Census to the 2013 population estimates. Texas and Florida exceeded North Carolina’s growth rate.