Charlotte region: Getting older, growing younger

The nation as a whole is getting older, but variations in population growth and immigration can create big differences in the median age from place to place. The Charlotte region is no exception. While Mecklenburg’s median age has risen only marginally, some neighboring counties are getting noticeably older. It turns out that migration, diversity and growth can result in younger populations.
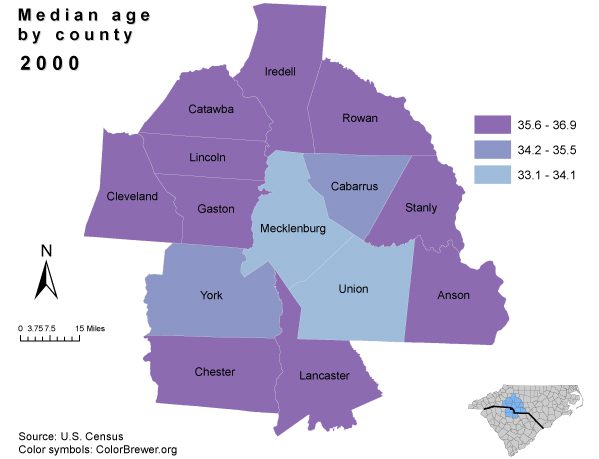
The map (below) shows the region’s median age by county in the year 2000 (median age is defined as the age at which half of the population is older, half is younger). For the country as a whole, the median age was 35.3 years in 2000, so most counties in the Charlotte region fell above the national median age. Click the “Age 2011” button above the map to see the change 12 years later.
Median Age
Age 2000Age 2011
Note: median age data are from the U.S. Census Bureau, population estimates
In the 2011 map, Mecklenburg has only moved up one year in median age from 33.1 to 34.1 years. The faster-growing suburban counties are near the national median age (37.2 in 2010), but the same set of counties that were in the highest age category in 2000 are substantially older, in terms of 2011 median age.
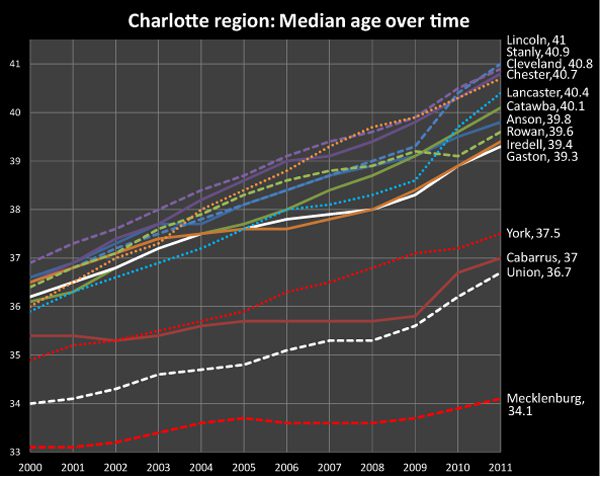
The graph below shows the evolution of this pattern over a period of years into these three categories: the youngest county (Mecklenburg) with a relatively stable median age, substantially below the national figure; the fast-growing suburban counties of Cabarrus, Union and York forming a second group near the national median age; the remaining 10 counties ranging two to four years above the national median age by 2011.

Source:U.S. Census Bureau, population estimates
Population growth rates have slowed since 2008 across the region. This slowdown is accompanied in several counties by an accelerating median age compared to the years before the economic downturn. (Cabarrus, Union, Gaston, Iredell and Lincoln are examples.)
The final graph shows the three “oldest” and “youngest” counties by median age and compares the number of persons age 65 and older in the years 2000 and 2011. The higher median age does not always translate into drastically larger numbers of people at retirement age. The much higher growth rates in places like Union County (which grew by more than 60 percent across all ages from 2000 to 2010) shows an 85 percent increase in people 65 and older from 2000 to 2011. Mecklenburg, the youngest in median age during the period, has 25,743 more people in the 65 and older segment of the population by 2011.
 Sources: U.S. Census 2000 & 2011 census population estimates
In the Charlotte region, the faster-growing counties have tended to have lower median ages. However, those same counties have also saw larger increases in the total numbers of people in older age groups.
The higher growth rates in Mecklenburg and the fast-growing suburban counties have not only resulted in relatively younger populations, but more racially diverse ones. Older populations tend to be whiter, and younger ones more diverse. This adds another dimension to the demographic differences among counties.
Policy makers in all these counties will have to contend with this complicated interplay of numbers and proportion as they plan for services for our aging population.
Click to read more about age changes in the region.
The Charlotte Regional Indicator Project provides tools for exploring these new population figures for the 14-county region with an interactive graph tool by clicking here. Figures on individual counties are available in the same format – click here.