2024: A Year to Remember
by Lori Thomas, Ph.D.
On December 6, the Institute + Data Trust celebrated the end of a successful investment campaign to support the development of an enduring community data infrastructure. The campaign was the first in the Data Trust’s 20-year history as a nonprofit organization. The celebration and demonstration of our new web portal mark a transition from an intensive period of infrastructure development to a future of broader and strategic community use of our data resources.
As we prepare ourselves for the new year and new opportunities afforded by the investments of our community partners, here’s a brief look at Institute + Data Trust highlights from 2024:
We wrapped up foundational technical improvements. As I write this article, we are wrapping up the first phase of the Data Trust’s web portal development in partnership with the division of OneIT at UNC Charlotte. The portal will provide more efficient access for our data partners and data users, as well as simplify the behind the scenes work of our staff and Data And Research Oversight Committee (DAROC) members.
For our data users, the data request process will be available online and researchers will be able to choose needed variables from a drop-down menu, rather than the lengthy back-and-forth process with our staff that preceded it. For depositing data partners, the portal will feature partner dashboards, which will provide a number of features including a description of data and data quality, and an annual and longitudinal look at how the people they serve are also served by other data partners.
We are betting that these improvements will lead to more information our community can use. Stay tuned for training opportunities on the new web portal.
Our Community Investors:
- Advocate Health
- Bank of America
- City of Charlotte
- Duke Endowment
- Foundation For The Carolinas
- The Gambrell Foundation
- Knight Foundation
- Mecklenburg County
- Trane Technologies
- United Way of Greater Charlotte
- UNC Charlotte
- UNC Charlotte School of Data Science
We introduced the State of Our Data report. Our annual meeting also marked the introduction of our annual State of Our Data report to ensure our stakeholders are informed about our community data infrastructure, our data, and how the data are being used in our community. The report will evolve as new partners join us and we report on new research questions and new uses of the data. We are already using information from the report about who is in our data to inform representation on our Board of Directors and its committees. The State of Our Data is one of the ways we seek to be transparent in our work and honor the investment of UNC Charlotte, our donors, and particularly our communities, whose lives are represented in our data.
We embraced a big IDEA. Thanks to an anonymous national funder, we kicked off the development of the Impact, Data, and Evaluation Academy (IDEA). Initially, IDEA will provide an affordable and accessible certificate program that allows individuals, particularly from small and grassroots organizations, to build foundational capacity in data management and evaluation. At an event in May, we listened to members of community organizations describe barriers to research and evaluation, as well as the assets they bring. Those insights drove the development of the curriculum. We will pilot the program with some of those same community members this spring and look forward to building on IDEA course offerings over time.
We grew our staff. We welcomed five new staff members to the Institute this year including four new research associates from diverse disciplines and experiences (in the order they joined us and with a nod to their discipline) – Mia Gaddy (economics); Jenny Niu (public health); Dr. Mecca Howe (anthropology), and Fatima Rodriguez Caba (social work). Fatimah Alnahash (computer science), a member of OneIT assigned to the Institute + Data Trust, joined our data science team in January. And our Director of Public Policy Research, Dr. Liz Morrell (geography and urban planning), joined us in October.
We worked on 28 unique community data and research projects. While we were at work on our infrastructure, we continued to work with community partners on their specific research and data needs. These ranged from data services for DreamKey Partners and the ongoing maintenance of the Charlotte-Mecklenburg Quality of Life Explorer to evaluations of the Beyond Open and Alternatives to Violence programs. It also includes partnerships making use of the Data Trust’s integrated data, including completing a follow-up study of long term educational outcomes of students whose families accessed homeownership through Habitat for Humanity.
We engaged with the people around us. While infrastructure and tools are critically important, as we note in the State of Our Data report, the strength of our infrastructure is dependent on our relationships – with the people who are in the data, the people that volunteer to govern and guide the work, the partners that share data, the people who use it, question it, and push the Institute + Data Trust to make our infrastructure more applicable. These relationships define us.
Our friends at Greenhouse Partners and Greenhouse Studios caught the transitional moment of 2024 well for us in a video developed for the Data Trust’s annual meeting. If you have about 10 minutes, we encourage you to view it.
We are grateful for your support and readership over this past year. If you’d like to hear more about any of our initiatives, please reach out in the new year. And if you would like to support the Institute and Data Trust, we welcome your year-end gifts – you can give online (enter the Urban Institute in the search bar) or through additional options.
Thank you and happy holidays!

Lori Thomas, Ph.D.
Executive Director
Charlotte Urban Institute + Charlotte Regional Data Trust
Our Data Are People: Charlotte Urban Institute Releases First-Ever “State of Our Data” Report
The Charlotte Urban Institute (Institute) + Charlotte Regional Data Trust (Data Trust) have studied the growth and challenges of our 14-county region for decades, working closely with community partners and other diverse stakeholders on issues ranging from homelessness to preserving our environmental resources. We exist to equip changemakers in our communities and region with data and information that kindles community transformation and makes a difference in people’s lives. Ultimately, as a nonpartisan, applied research and community outreach center, we not only seek solutions to the social, economic and environmental challenges facing our communities, we also work to help people in the community understand our findings through data-driven insights.
This year, we are proud to share more about who we are, our work and our partners, the data we hold in trust today, and our vision for the future through our inaugural State of Our Data report.
Why Now?
Our data are people. Whether describing people or the places they live, the data we hold, curate, and use for research and decision-making reflect human lives. Much of Data Trust data is collected during very difficult points in people’s lives. This brings added responsibility, both in terms of protecting the privacy of data, but also in using it so it benefits the people reflected.
Equipping changemakers requires infrastructure – the components, systems, and practices necessary to consistently, effectively, and ethically put data to use for community benefit. The State of Our Data Report provides a pathway for the Institute + Data Trust to highlight this enduring infrastructure.
New research shows stable housing may lead to positive educational outcomes
North Carolina public schools reported 35,282 students experienced some type of “inadequate” living situation during the 2022-23 school year. Of the students in these living situations, ranging from residing in an overcrowded dwelling to being homeless, 4,815 were students of Charlotte-Mecklenburg Schools (CMS). Given the increasing number of students identified as McKinney-Vento in the last few years, Habitat for Humanity of the Charlotte Region partnered with the Charlotte Urban Institute to study the potential implications of homeownership on childhood well-being. Institute researchers studied educational outcomes of Habitat’s homebuyer program participants to answer the following research questions:
- How did in-school presence (suspensions, absences) and academic (math and reading) outcomes change for Habitat children after their family purchased a home?
- How do these changes compare to a representative sample of McKinney-Vento students?1
To test whether living in Habitat housing influences educational outcomes for students, the study first pairs Habitat students with a representative sample of McKinney-Vento (McKinney) students. The Habitat homebuyer program aims to make homeownership more affordable and, as a result, more stable for families. This allows us to question whether Habitat housing influences students’ academic and educational outcomes.
To minimize the differences between Habitat students and their comparison peers, students were matched on their gender, race/ethnicity, attended school zip code, grade level, and school year. This type of design allows the researchers to:
- Account for other potential influences on the outcomes of interest, such as student demographics and educational outcomes from the previous year (previous number of absences, suspensions, and proficiency levels).
- Estimate the direction (positive or negative) and magnitude of the association between Habitat housing and these outcomes.2
Key Takeaways
The results of this study support positive outcomes for students of Habitat homeowners. Here are the key takeaways:
Habitat students are more present in the classroom
The analysis found that, on average, Habitat students consistently had fewer absences than their McKinney peers (9.4 days absent compared to 17.5).
Figure 1: Habitat students are expected to have significantly fewer absences than McKinney students
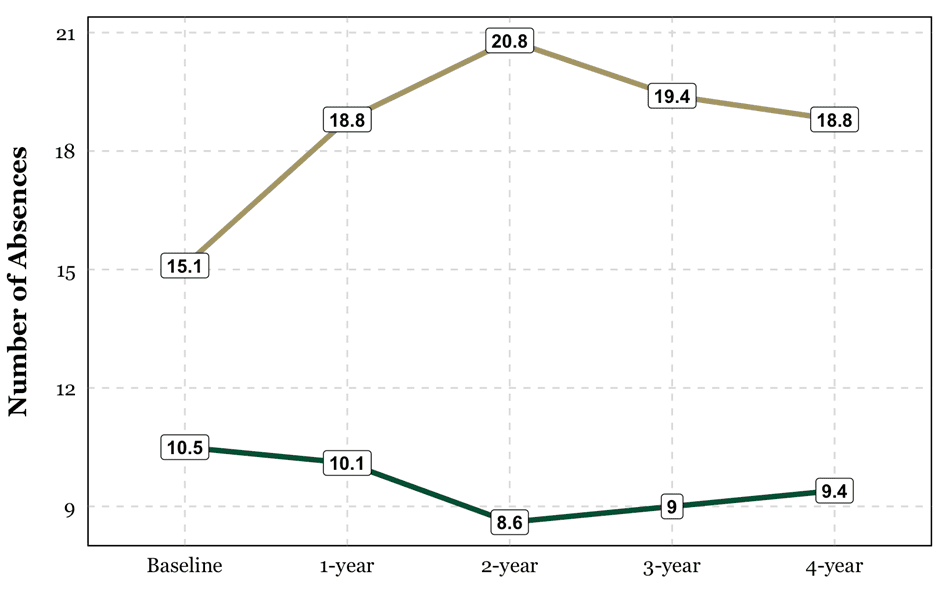
Note: The gold line denotes McKinney-Vento students; green denotes Habitat students
During the baseline year, the year a student moves into Habitat housing, Habitat students are expected to be absent from school for approximately ten days compared to a surplus of 15 days for their McKinney peers. The difference between these two groups grew for the next two years before the number of absences increased for Habitat students. However, they remained significantly lower than McKinney students.
Figure 2: Habitat students are less likely to be suspended for the first several years after moving into housing
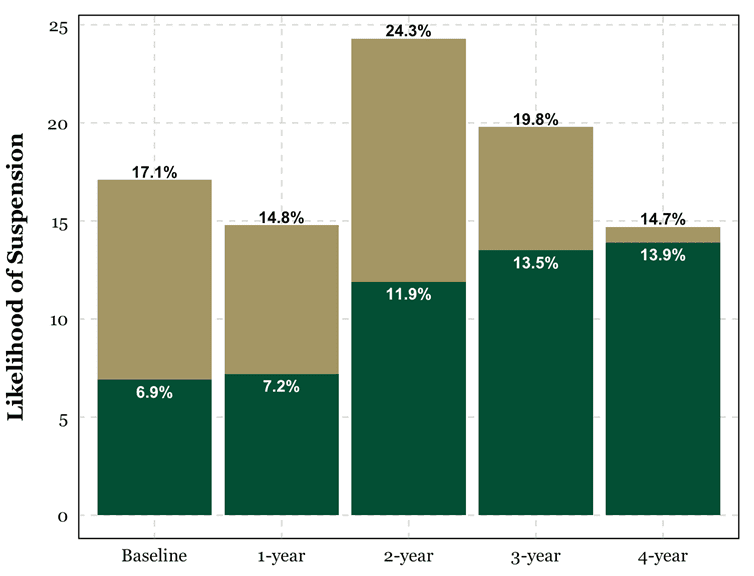
Note: The gold bars denote McKinney-Vento students; green denotes Habitat students
When the likelihood of a student being suspended at least once (either in-school or out) during the academic year was examined, we found a similar outcome. The likelihood of suspension for students in Habitat housing remained significantly lower than their McKinney counterparts until the second year of housing. However, this difference became insignificant for the third and fourth post-baseline years, which implies that Habitat housing no longer impacts a student’s likelihood of suspension as time passes.
Habitat students achieve higher proficiency levels
Calculating the expected probability of Habitat/McKinney students reaching proficiency levels during End-of-Grade (EOG) testing further illustrates the difference between these two groups.3
Table 1: Habitat students are significantly more likely to achieve proficiency levels in both Reading and Math the longer they stay in housing
| Reading | Math | ||||||
| McKinney | Habitat | Difference | McKinney | Habitat | Difference | ||
| Baseline | 22% | 22.2% | 0.2 | 24.4% | 37.3% | 12.9 | |
| 1-year | 23.1% | 24.6% | 1.5 | 35.3% | 38.5% | 3.2 | |
| 2-year | 10.9% | 31.7% | 20.8 | 39.1% | 50.9% | 11.8 | |
| 3-year | 19.8% | 39.4% | 19.6 | 35.7% | 53.1% | 17.4 | |
| 4-year | 20.4% | 33.3% | 12.9 | 37.5% | 55.6% | 18.1 | |
While Table 1 shows that Habitat students are more likely to reach proficiency levels in Math, the difference between Habitat and McKinney students is not considered statistically significant. This means the “higher” expected proficiency levels for Habitat students could be due to chance or other random factors. This narrative shifts, however, in the final two years. In the third and fourth years after moving into housing, Habitat students have a 53% and 55% likelihood of achieving proficiency, respectively, while their McKinney peers stay below 40%.
A similar relationship is found for Reading as the difference in expected proficiency between Habitat students and their McKinney peers in the first two years is insignificant. After those two years, however, McKinney students saw a drop in their likelihood of acquiring proficiency while Habitat students continued to experience increased likelihoods of Reading proficiency. While these numbers continue to change over the next two years, the conclusion remains: Habitat housing positively and significantly impacts the likelihood that students will achieve proficiency levels in Reading the longer students stay in housing.
The Importance of Homeownership
The findings from this study underscore the importance of Habitat homeownership in promoting positive student outcomes. This may appear unsurprising, but academic literature remains split over the relationship between stable housing and student outcomes. Several studies find that the influence of housing becomes nonexistent once researchers control for other factors.
Taking inspiration from recent findings that housing stability can improve a child’s educational outcomes, this study utilizes a rigorous research design that paired Habitat students to a representative comparison group of students designated as McKinney-Vento and conducted an analysis that accounted for several important demographic and educational factors of said students. The results show that homeownership through Habitat significantly impacted a student’s academic success compared to McKinney students.
However, it is essential to avoid overstating the impact of the findings. The analysis indeed demonstrates the effect of Habitat homeownership on student outcomes compared to students experiencing housing instability (McKinney); however, many of the outcomes of interest see Habitat students improving only through the first two years of stable housing before the impact becomes insignificant. That conclusion, however, only encompasses the behavioral indicators of attendance and suspensions. The reverse occurs with academic outcomes, specifically obtaining proficiency in EOG testing for Reading and Math, as the influence of Habitat housing only becomes significant the longer children are housed.
The research indicates that the effect of housing on educational outcomes is a complex relationship. This demonstrates the need for further exploration and research on the benefits of housing stability.
Footnotes:
1 The term McKinney-Vento comes from the McKinney-Vento Homeless Assistance Act, a piece of legislation aiming to ensure that students experiencing homelessness have equal access to educational services and resources. Some of the situations in which students can be designated as McKinney-Vento include, but are not limited to, if they use emergency shelter, transitional housing, sleep in unsheltered locations, or live in doubled-up situations with family/friends.
2 The results/findings discussed below are the predicted outcomes or the likelihood of these outcomes. After using regression modeling to determine the general difference between Habitat and McKinney students, post-estimation techniques are utilized to obtain specific predictions given different criteria. For example, this allows the research to predict the number of absences for Habitat (McKinney) students over time while still accounting for other potential influences.
3 When looking at Math and Reading end-of-grade (EOG) test scores, it is important to note that North Carolina implemented a state-wide change concerning end-of-grade testing in 2012-2013. The Standard Courses of Study (SCS) changed the structure, material, and scoring mechanisms of standardized tests based on Common Core standards. The analysis discussed in this post, therefore, only looked at 2013 and onwards.
New community training initiative aims to help nonprofits tell better stories
Data tells the story of our lives. It is gathered from our Apple watches, Netflix selections, and grocery membership cards.
What story does your data tell?
The stories our data tell are of great importance, as data helps us understand ourselves and make informed decisions for the future. This is also true of nonprofits, who use data to tell their stories time and time again to funders, prospective funders, the community, and their staff.
The Charlotte Urban Institute (Institute) is committed to helping equip nonprofits to tell their stories. In our traditional role, we act as third-party evaluators for our nonprofit partners. We help partners manage their data and understand what aspects of their programs are working and creating impact, and what areas could be improved.
With support from an anonymous funder, the Institute is now developing another pathway to support nonprofit data storytelling: the Impact, Data, and Evaluation Academy (IDEA).
Empowering Nonprofits: A New Data Training Initiative
In May 2024, the Institute hosted a four-hour Group Level Assessment (GLA). This participatory research event was used to inform the curriculum design and development of IDEA, a new nonprofit certificate program in data management and evaluation. Forty-eight (48) racially- and gender-diverse participants attended the event. Of the attendees, 22 represented small, grassroots nonprofits; 10 represented medium-to-large nonprofits, 13 were content experts; and three participants were funders.
The GLA generated over 1,100 individual responses to 22 wall-mounted prompts. The prompts centered around nonprofit assets, barriers, and learning styles. Below are a few examples of the of prompts included in the exercise:
- “Program/client success looks like ______”
- “In my experience, the relationship between funders and nonprofits struggles when____”
- “As we move forward with developing a data and evaluation curriculum, we need to consider____”
Participants then identified themes that arose from individual responses, and the research team, led by Rosalyn Allison Jacobs of ROI Impact Consulting, refined and condensed them.
From this research, three key findings were identified about the type of data-storytelling support Charlotte nonprofits need to better inform their work.
Key Findings
While the full executive summary can be found here, the three key findings from the research are as follows:
- Empathy and equity-focus are nonprofit strengths. The ability of small, grassroots nonprofits to serve clients with empathy and through an equity perspective is a strength. This includes centering clients and the community in the work, meeting clients where they are, and designing interventions around identified needs rather than being prescriptive and inflexible.
- Misalignments between nonprofits and funders are barriers to effective data management and evaluation. Specific examples included perceptions that funders prefer metrics that do not capture qualitative client outcomes and impact, that funders value return on investment (ROI) over human-centered factors, and that reporting requirements are “too heavy [and] takes time away from the real work.”
- Nonprofits need the curriculum to meet them where they are. All GLA participants stressed the importance of meeting nonprofits where they are, in terms of the scope and complexity of the curriculum content. There exists a continuum of educational needs and capacity among nonprofits that will need to be accommodated.
Next Steps (and a free resource!)
The Charlotte Urban Institute and our community and university partners are actively developing a course curriculum guided by findings from the GLA. In spring 2025, we will pilot a five-day certificate program in data management and evaluation, offered at no-cost for pilot participants. The course is specifically designed with small nonprofits in mind.
If your nonprofit organization is interested in learning more about this course, please reach out to Bridget.Anderson@charlotte.edu.
Data You Can Use: The Charlotte-Mecklenburg Quality of Life Explorer
by Katie Zager and Mary Ann Priester
This blog was originally posted on the Building Bridges Blog, a communication of Mecklenburg County’s Housing & Homelessness Division.
Are homes in your neighborhood getting bigger or smaller? Are residents in a specific community able to access essential services, such as grocery stores, or public transportation? Where should our community building efforts be focused? The Charlotte-Mecklenburg Quality of Life Explorer can help answer these questions and many more.
This blog provides a brief overview of the Charlotte-Mecklenburg Quality of Life Explorer and how it can be used to better understand various housing dimensions at the Neighborhood Profile Area level.
QUALITY OF LIFE EXPLORER
The Quality of Life Explorer (Explorer) is an online dashboard that contains information on over 400 neighborhoods in Charlotte and, in some cases, has data going back nearly a decade. There are over 80 different variables on the Explorer, including basic demographic information, such as population, educational attainment, and median household income. It also contains information about things like recycling participation, calls to 311, or housing code violations that are gathered from local administrative data sets.
The data are organized into nine dimensions: Character, Economy, Education, Engagement, Environment, Health, Housing, Safety and Transportation.
HOUSING DIMENSION
The housing dimension contains information that might be of particular interest to those who read this blog. There is information on home ownership, median rent and occupancy rate, but, more importantly, the local data allows us to track change over time.
Home sales price: Did you know that the average home sale price in Mecklenburg County increased from $267,916 in 2013 to $490,212 in 2023? In some neighborhoods, home sales increased by over 600%.
Residential new construction: Did you know that since 2015, Mecklenburg County has been adding over 10,000 new residential units (both single and multi-family) a year? This is compared to just 3,418 units that were added in 2011, during the Great Recession.
Residential Foreclosures: With increasing home values, and a stronger economy, the number of residential foreclosures in Mecklenburg County has plummeted, from 1,000s of units in 2015-2016, to just 59 in 2023.
Other variables include housing density, housing age, residential renovation and demolition permits, average housing age and size, single family rentals, single family units, housing code violations, and affordable housing. The number of affordable housing units only includes those where the developer is receiving tax credits or other government support in return for providing income-restricted housing units.

USING THE DATA
The basic layout of the Explorer contains a map, with values for all 462 neighborhoods, which we call Neighborhood Profile Areas (NPAs). You can find an NPA of interest by searching for an address in the search bar or clicking it on the map. Once you click on an NPA, it will be highlighted on the map in pink, and you can compare the value for that NPA to the rest of the county.
In the image above, we have selected NPA 476, which encompasses the four wards of Uptown. Average Home Sales price in 2023 was slightly below the county average in these neighborhoods. Clicking on more than one NPA allows you to compare the value in the entire selected area to the county. You can look at things like city council districts, parts of town such as “East Charlotte” or corridors, such as neighborhoods along Beatties Ford Road. The time slider below the map allows you to change the year of the data you would like to view, while the line graph to the right of the map allows you to look at how the values have changed over time.
Although not captured above, the Explorer also contains buttons you can use to navigate to different pages, and below the map, you’ll find more in-depth information about the data. You can also download the data for use in your own research or project.
SO WHY DOES THIS MATTER?
The Quality of Life Explorer is unique in that it allows us to look at data across both space and time. It can be used to focus on one neighborhood and explore what has happened there over the last decade, or to look for patterns and compare characteristics and values between different neighborhoods. The Explorer can be a powerful tool for determining where and how to allocate resources, determine need for programs and services, evaluate and justify need, or can simply provide a better understanding of what is going on in the community. The Explorer makes data accessible and actionable and provides an important resource that should be used to make data driven and informed decisions to address homelessness and housing in Mecklenburg County.
The Charlotte-Mecklenburg Quality of Life Explorer is the result of a partnership between the UNC Charlotte Urban Institute, the City of Charlotte, and Mecklenburg County. The Explorer can be found online at www.mcmap.org/qol
Katie Zager is a research associate at the Charlotte Urban Institute.
Mary Ann Priester is a senior management analyst with Mecklenburg County Community Support Services.
Liz Morrell Appointed Director of Public Policy Research
Liz Morrell ’11 M.A., ’18 Ph.D. was recently named director of public policy research for the UNC Charlotte Urban Institute, a unit within the Division of Academic Affairs.
In this role, Morrell will lead a program of applied public policy research and analysis for the Urban Institute with a primary focus on the local and regional policies related to determinants of a good quality of life for Charlotte-area residents. Key areas include housing, transportation, health and mental health, education, the economy, the environment, civic engagement and public safety. She also will pursue funding opportunities that engage the institute’s research staff and University faculty in research that informs regional policy issues.
Lori Thomas, executive director of the UNC Charlotte Urban Institute and Charlotte Regional Data, Trust, stated, “Not only will Liz build relationships across our 14-county region and guide the launch of new research and policy tools like the Regional Explorer, she brings with her rich local government experience and housing and urban planning research background that is key to our work — especially as we work to expand our efforts to meet research and data needs across the region.”
Prior to joining the University in October, Morrell held positions with Mecklenburg County Park and Recreation, starting as a management analyst before serving as the strategic planning and historic, cultural and community resources manager.
“I’m excited to bring my mixed-methods and participatory research skills back to an academic setting where robust resources will truly allow me to expand the great work we’re doing in the community,” said Morrell.
A graduate of Purdue University, Morrell completed a master’s degree in geography and a Ph.D. in geography and urban/regional analysis from UNC Charlotte.
Explore the Charlotte Journalism Collaborative’s 2024 Election Guide
With less than 30 days until November 5, also known as Election Day in the United States, the UNC Charlotte Urban Institute supports our partners at the Charlotte Journalism Collaborative (CJC) in their efforts to ensure all Charlotte residents are equipped with reputable information to be civically engaged.
The 2024 CJC Election Guide is a project of the CJC that is solely intended to be an informative resource. For more information, visit charlottejournalism.org.
About Our Partnership
In 2023, the UNC Charlotte Urban Institute became a data partner for the Charlotte Journalism Collaborative (CJC). The CJC is a collective of more than 20 reporters spanning six Charlotte newsrooms. The group was establuished in 2019 with support from The Knight Foundation.
The goal of the CJC, much like ours, is to seek solutions for the wellbeing of Charlotte’s residents. Whereas the Charlotte Urban Insitute seeks solutions to the social, economic, and environmental challenges facing our communities through data-driven research, the CJC is committed to making access to trusted information a reality for all in the Charlotte community, and strengthening vital connections that can make positive change and drive informed development for the city’s future.
Our role, as the premier CJC data partner, is to support the CJC by providing access to reputable data sources, tools, data translation/interpretation, and to amplify their work inasmuch as it informs those in our region about relevant topics of interest and encourages them to engage.
Note: The Charlotte Urban Institute is a nonpartisan institute and does not take stances on political issues or in elections. As a public university, UNC Charlotte, and its associated divisions and units, respect and adheres to state laws and mandates by the UNC System.
A look at income inequality in the Charlotte Region
By Katie Zager
You may have heard expressions like, “they’re in a different tax bracket” or “we are the 99%.” These phrases, which pop up on social media, and in the occasional news headline, refer to the presence of income inequality in the United States. That is, they are concerned with the percentage of money people take home and the percentage of total dollars they earn in a given year.
Income inequality has long been measured on the national scale. It’s also been compared over time to help people understand whether the economic activity in a given place benefits all residents, or just a select few. Recent studies however, have gotten a bit more granular. They zoom in on income inequality at the neighborhood scale.
In the United States, high levels of inequality:
- have been associated with poorer health outcomes,
- are correlated with individual financial wellbeing,
- impacts levels of social cohesion,
- and influences a person’s perceptions about equality in America.
Studies on economic mobility, which have been particularly relevant to Charlotte in the last decade, found that social interactions among people of varying classes and incomes are a key ingredient to lifting children out of poverty.
In this article, we look at neighborhood-level (census tract) income inequality in the Charlotte region, using the Gini Coefficient published in the 2022 American Community Survey. The Gini Coefficient, sometimes known as the Gini Index, measures income inequality by comparing a perfectly equal distribution of income to the actual distribution in that neighborhood. For example, a Gini Index score of 0 would have 10% of households making 10% of the income, 20% making 20%, etc. A Gini Score of 1 means that 1 household gets 100% of the income. Therefore, a lower Gini Index score means there is less income inequality in that neighborhood.
Both equal and unequal neighborhoods can be found throughout the Charlotte region.
Throughout our region, neighborhoods range from having Gini Coefficients as low as .22 (confidence interval .11-.31), to as high as .66 (confidence interval .45-.87). The median level of neighborhood inequality was .4075, which is on par with the U.S. national value. Gini coefficients in the .5 to .6 range are generally considered some of the highest in the world, although the implications of inequality on a neighborhood and national scale are quite different.
In the Charlotte region, the highest levels of inequality can be found in some south Charlotte neighborhoods, in the eastern part of Gaston County, and in the towns of Boiling Springs, Maiden, and Salisbury. Upon closer inspection, many of these neighborhoods have amenities such as lakes/rivers, colleges, and golf courses that might attract high-income residents.
Map 1: The Gini Index of Income Inequality by Census Tract
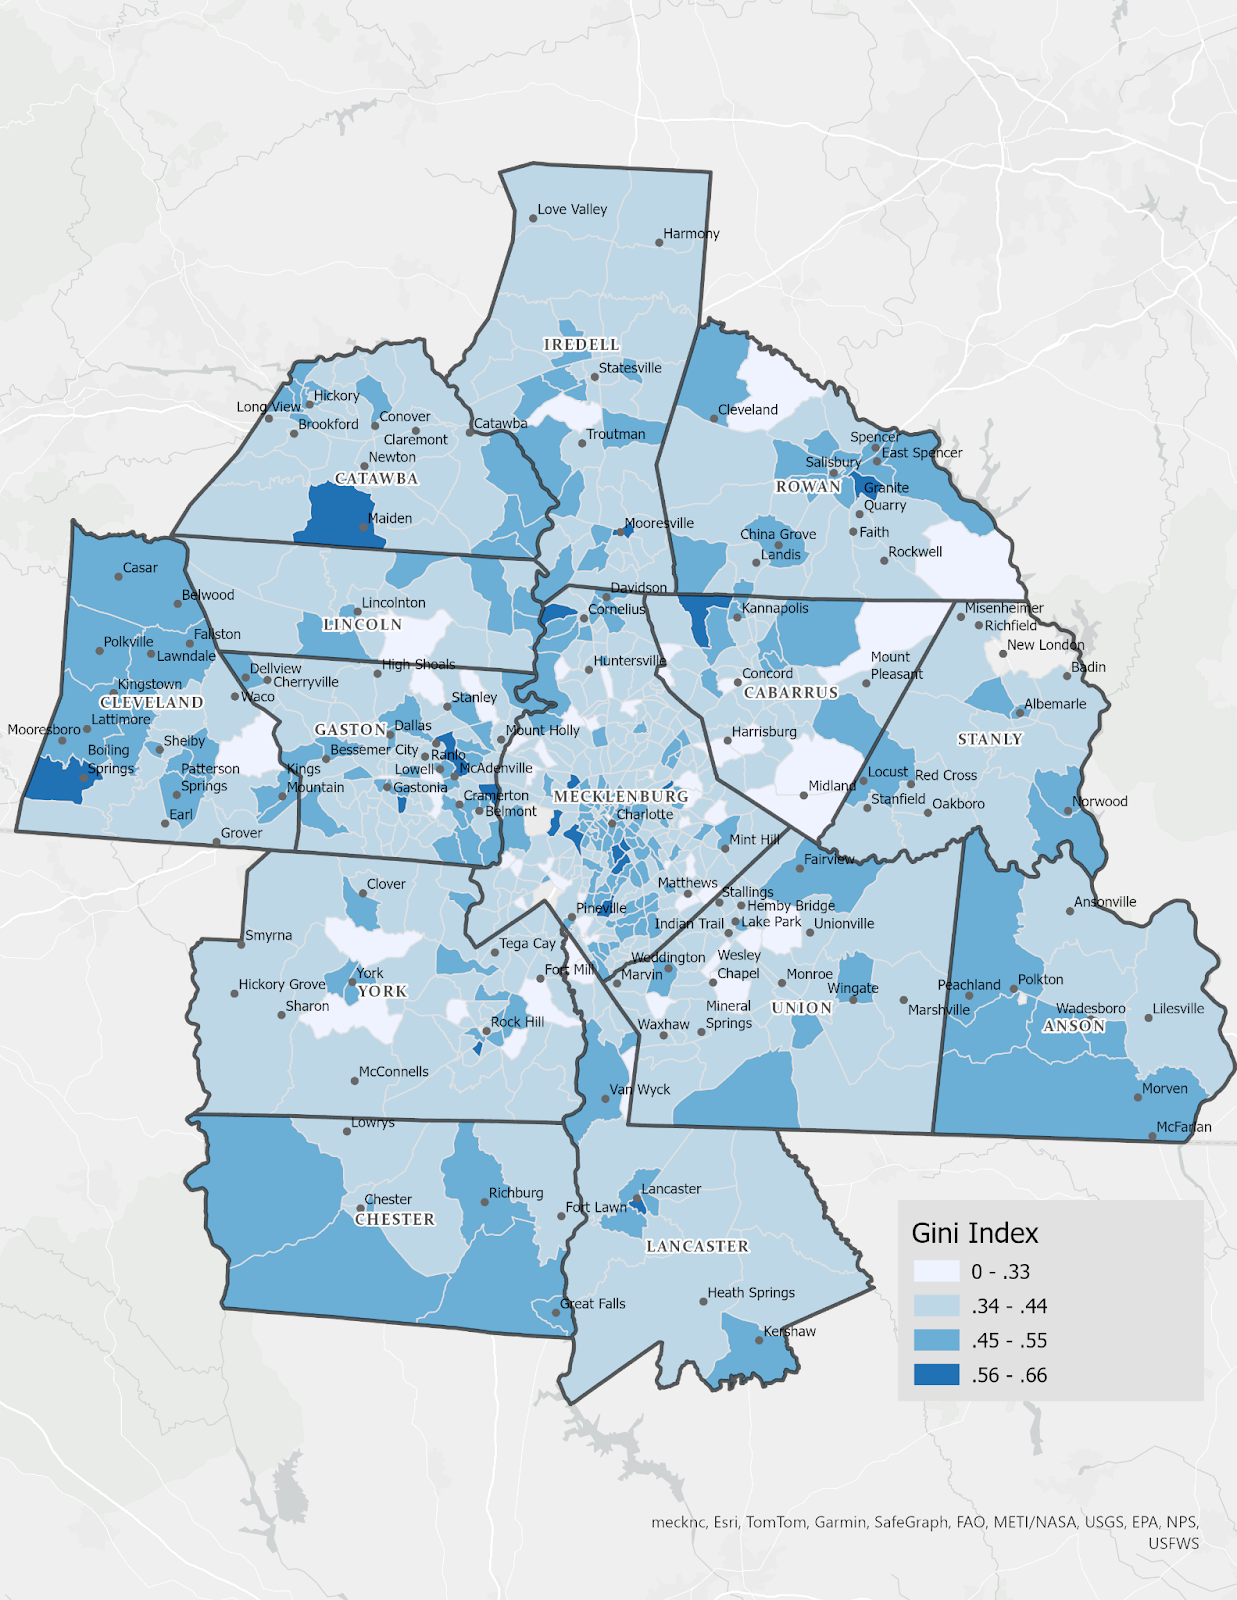
Data Source: 2022 American Community Survey, 5-Year Estimates
But incomes matter, too.
The main limitation of the Gini Index is that it compares the distribution of a neighborhood’s income to that neighborhood’s average, but does not give any indication of whether or not that average is high or low. A neighborhood can be unequal because it looks like a modest village with a castle on the hill, or a bunch of high-end skyscrapers, with an affordable housing development tucked away inside. The Gini Index treats them as the same.
One way to solve this issue is to incorporate median household income into the interpretation of the data.
The map below, a bi-variate map, is shaded to show both the level of income inequality (Gini Index), and the median household income. This will give you an idea of whether the majority of households are on the higher or lower end of the income spectrum.
Looking at the color of an area on the map, higher income areas are tinted pink (the higher the income, the pinker the color). The bluer the tint, the higher the inequality. Keep reading below to get more detail about the types of neighborhoods you might see on the map.
Map 2: Income Inequality and Median Household Income by Census Tract
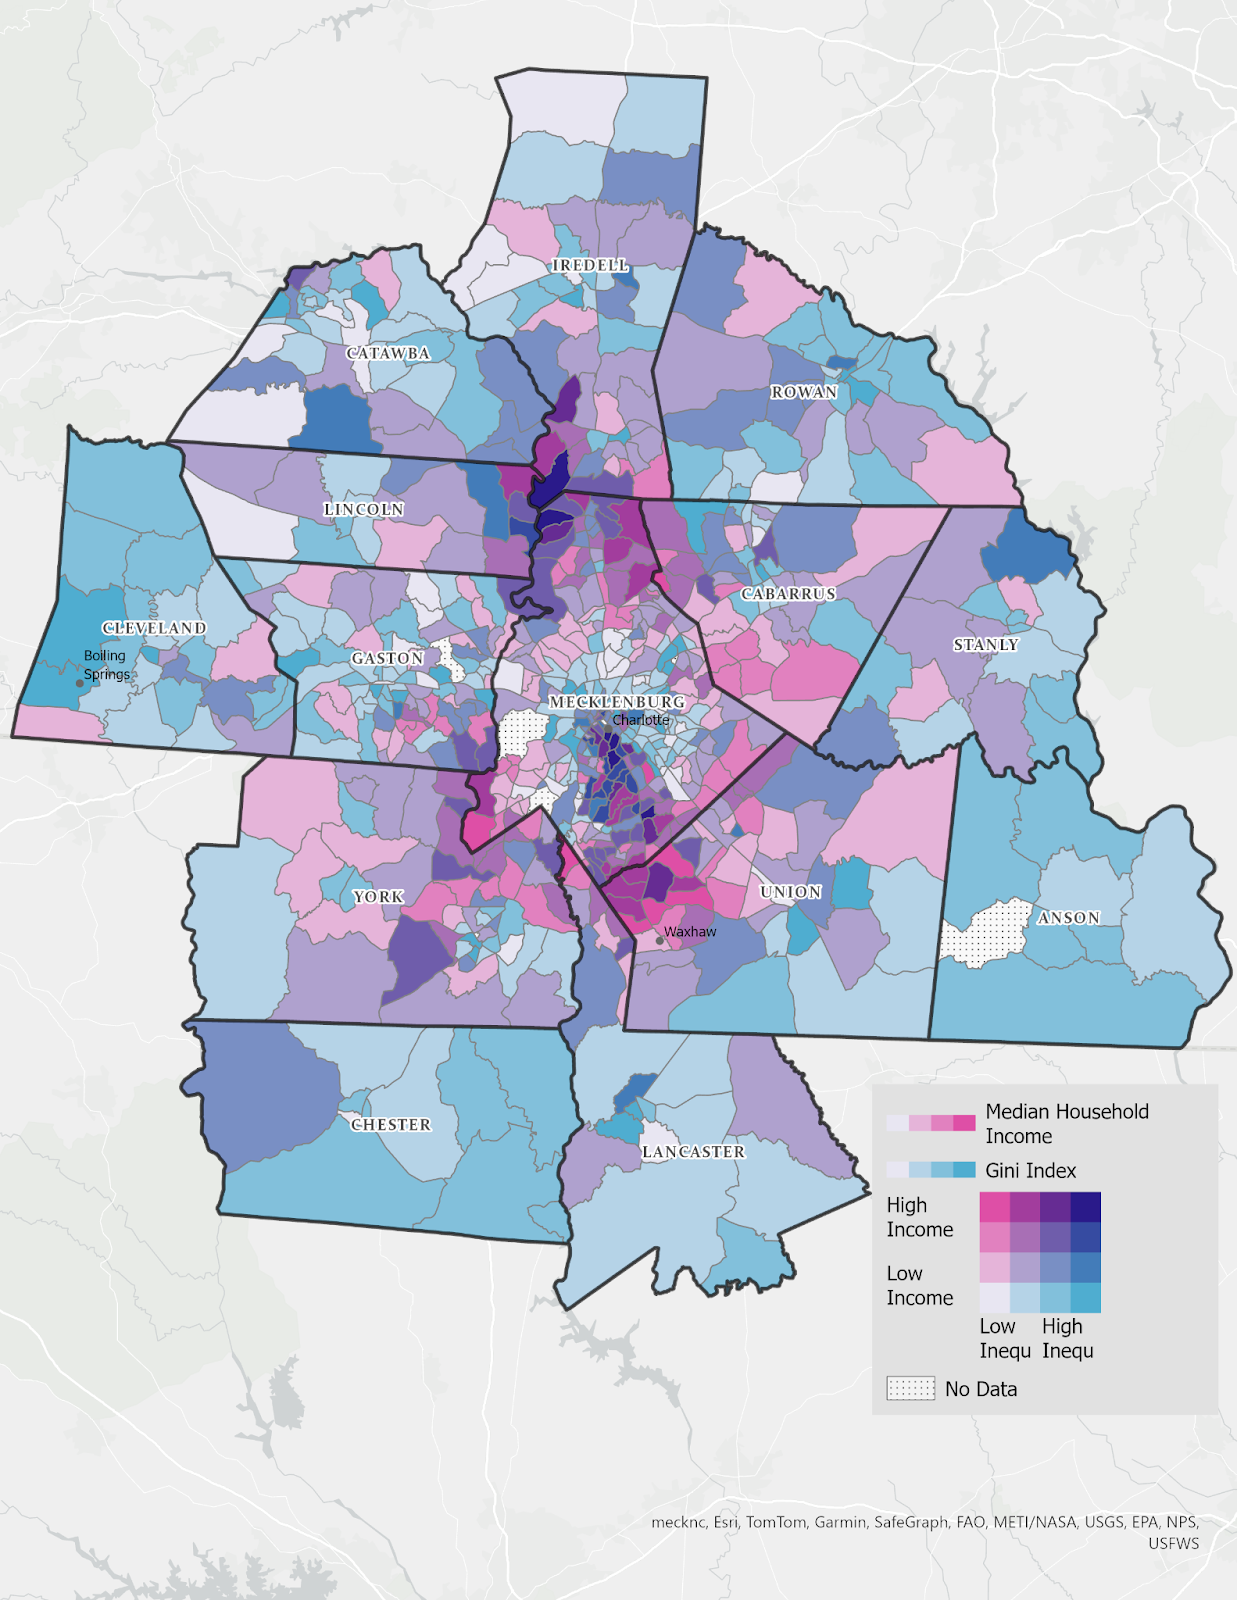
Data Source: 2022 American Community Survey, 5-Year Estimates
Lower Income, High Inequality (medium blue) These areas have low median incomes, but a sizable enough portion of people with very high incomes. So much so that the average distance from the median is quite high. One example of this is in Boiling Springs, where the median income is $61,539, but 7% of the population makes over $200,000 a year. Almost 4 times the median income!
In these areas, most households are low-to-moderate income, with a few select households earning a large slice of income.
High Income, High Inequality (dark purple) These areas have high median income, but a sizable enough portion with low incomes, that again, the average distance from the median is quite high. One example of this is the Foxcroft neighborhood. You’ll find this just southeast of center city Charlotte. There, the median income is $186,128, but 18% of households make less than $50,000.
In these areas, most households have very high incomes, but about 10-20% of households have lower incomes. Here, a lower-income household might be surrounded by many high-income households, without much in between.
High Income, Low Inequality (deep pink) These areas have a high median income, but relatively few households with low incomes. Many households in these areas have incomes close to the median. An example of this can be found in a neighborhood just north of Waxhaw, where the median income is $222,759, and almost 75% of households make over $100,000 a year.
In these areas, most households are very high-income, and less than 10% of households are lower-income. These are areas of concentrated wealth.
Lower Income, Low Inequality (light purple) These areas have relatively low median income, and relatively few households with very high incomes. A large number of households in these areas have incomes close to the median. One example of this is a neighborhood north of center city Charlotte, where the median income is $50,625. Here, just 3% of households have incomes over $200,000.
In these areas, there is a concentration of lower-income households. Lower levels of inequality mean that an individual has a good chance of meeting someone with a slightly higher income, but that income is still likely to be below average for the region.
Moderate Income, Moderate Inequality (purple) These areas in the middle of the scale have both median incomes and levels of inequality that are closer to average for the region. Overall, incomes are more evenly distributed across the spectrum. For example, a census tract in eastern Cabarrus County has a median household income of $75, 809, but about 30% of households have incomes below $50,000 and 20% have incomes between $100,000 and $200,000.
These areas are likely to have a more diverse housing stock that is able to attract families and individuals from across the income distribution. And while very high income households are present, they hold a more proportionate share of the resources in the area.
You can use the drop-down menu on the chart below to see the income distribution for the example neighborhoods.
Figure 1:

What does this mean for the people living in these types of neighborhoods?
Neighborhoods with varying levels of income and inequality can be found throughout the Charlotte region. While there are some broad patterns in where higher-income households live, levels of inequality in more rural and lower-income areas can sometimes rival those found in higher-income neighborhoods. Indeed, there are a number of county level and local policies that can impact the levels of inequality we see, including what kind of housing gets built where, what kind of natural and man-made amenities an area has, as well as the overall nature of the city, town, or county economy.
Still, outside of the policy realm, the distribution of income and wealth in a given neighborhood can have significant impacts on the quality of life for the people who live there. Here are a few questions to get you thinking about how income inequality impacts you and your neighbors:
1.What does it mean in terms of who has influence or who holds power?
2.What does it mean to have a few high income individuals as neighbors, but a low probability that you will actually encounter them?
3. Where is inequality most visible? Where is it invisible? Are there places where low-income households are largely out-of-sight, out of mind?
References:
- 1Linda Zhao, Philipp Hessel, Juli Simon Thomas, Jason Beckfield; Inequality in Place: Effects of Exposure to Neighborhood-Level Economic Inequality on Mortality. Demography 1 December 2021; 58 (6): 2041–2063. doi: https://doi.org/10.1215/00703370-9463660
- 2Neman, T.S. Does Your Neighborhood’s Income Distribution Matter? A Multi-scale Study of Financial Well-Being in the U.S.. Soc Indic Res 152, 951–970 (2020). https://doi.org/10.1007/s11205-020-02458-w
- 3Minkoff, S. L., & Lyons, J. (2019). Living With Inequality: Neighborhood Income Diversity and Perceptions of the Income Gap. American Politics Research, 47(2), 329-361. https://doi.org/10.1177/1532673X17733799
- 4https://opportunityinsights.org/wp-content/uploads/2022/07/socialcapital_nontech.pdf
Understanding corporate landlords: Who are they?
This article is the second in a series intended to demystify corporate landlords. Click here to read the first, “Understanding Corporate Landlords: Decoding a Recent Housing Phenomenon.”
Identifying corporate landlords, sometimes referred to as real estate investment trusts (REITs) or institutional investors, can be a complicated process. Errors, including misspellings, inaccurate records, or missing information, are common in administrative data reporting (An et al., 2024). Corporate landlords can also have dozens of subsidiaries with unique names that mask the actual size of their portfolio.
So, how can we differentiate between “independent operations”, individuals who own one or two properties often under Limited Liability Companies (LLCs), mom-and-pop investors, those who own between three and nine properties, and the more large-scale operations of corporate landlords?
The research team at the Charlotte Urban Institute is developing a multi-step method to address this issue using the 2023 parcel-level tax data in Mecklenburg County (Mecklenburg County Land Records Management, 2024).
Identifying corporate owned single-family homes
According to Mecklenburg County, incorporated organizations owned around 29,000 single-family homes at the end of 2023 (2024). This includes corporations registered within and outside North Carolina as demonstrated in Table 1 below.
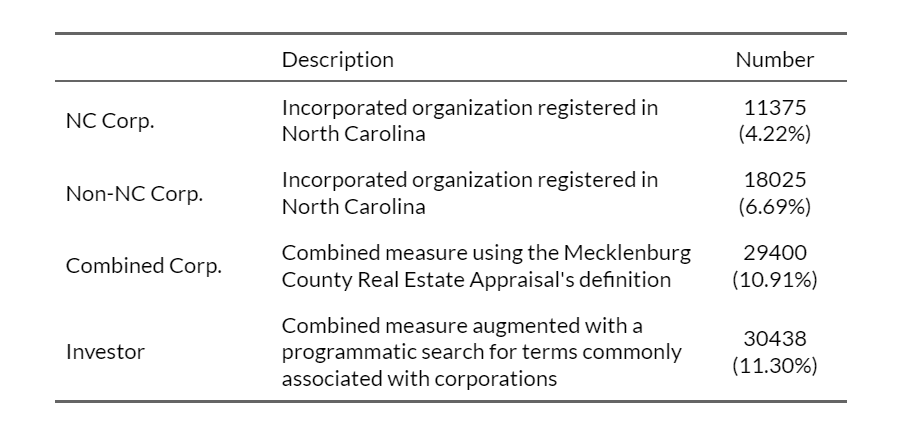
We take an additional step to search the property owner’s recorded name for terms commonly associated with corporate investors, as denoted by Redfin, The Washington Post, and the North Carolina Secretary of State. Our augmented conception of a corporate owner, therefore, includes any account indicated as containing keywords commonly associated with corporate landlords: corporation, incorporated, limited, LLC, and LP; in addition to accounts listed as a local (NC) or out-of-state (Non-NC) corporation.
This provides us with an initial number of 30,438 investor-owned houses, approximately 11.3% of all single-family homes in Mecklenburg County.
Linking similar corporations and their subsidiaries together
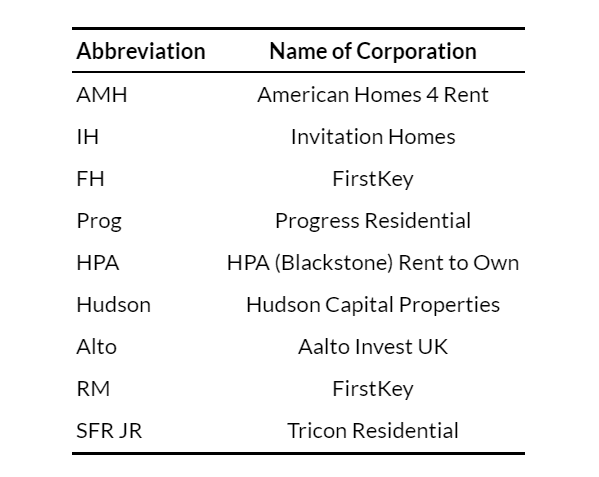
Scholars and practitioners have noted that many corporations own subsidiaries with slight deviations in their names. For example, American Homes 4 Rent appears to have over two dozen different subsidiaries listed as owners, including AMH NC Properties Two LP, AMH 2015-1 Borrower LP, AMH NC Development LLC, and AMH 2014-3 Borrower LP.
As owners’ names may not match perfectly, we use a technique known as fuzzy text search to find approximate matches or similarities between strings, i.e., owner names. While interested readers are encouraged to read the technical documentation for a complete description of this process, the goal is to create a new variable with a common name assigned to the owner names that are determined to be similar.
The process includes:
- Defining a threshold for grouping similar names
- Calculating the similarity between all owner names
- Identifying similar names by comparing the distances to the defined threshold
- Getting the names of similar investors as a list based on said comparison
- Iterating over each group and assigning a common name to each group
Simply put, each owner name is assigned a number that groups similar owner names together before we loop through each group and assign the most commonly used within said group.
Instead of relying on this manual grouping of similar corporations, we leverage The News & Observer (2022) and our previous work on the North Mecklenburg Demographic and Housing Assessment (Zager et al., 2023). The dataset provided by The Observer includes a crosswalk of the primary corporations and their various subsidiaries, similar to what we calculated manually above. At the same time, the North Mecklenburg report allows us to assign owners to specific corporations based on pattern matching within the common group names column. For example, if the common name contains the substring “AMH,” indicating a match to “AMH” in the name, it assigns the label “American Homes 4 Rent” to the common name column. If none of the patterns match, it converts the name value to a unique character.
This process reduces the number of “unique names” for owners of single-family homes in Mecklenburg County from 23,895 to 5,755.
The number of corporate landlords in Mecklenburg County
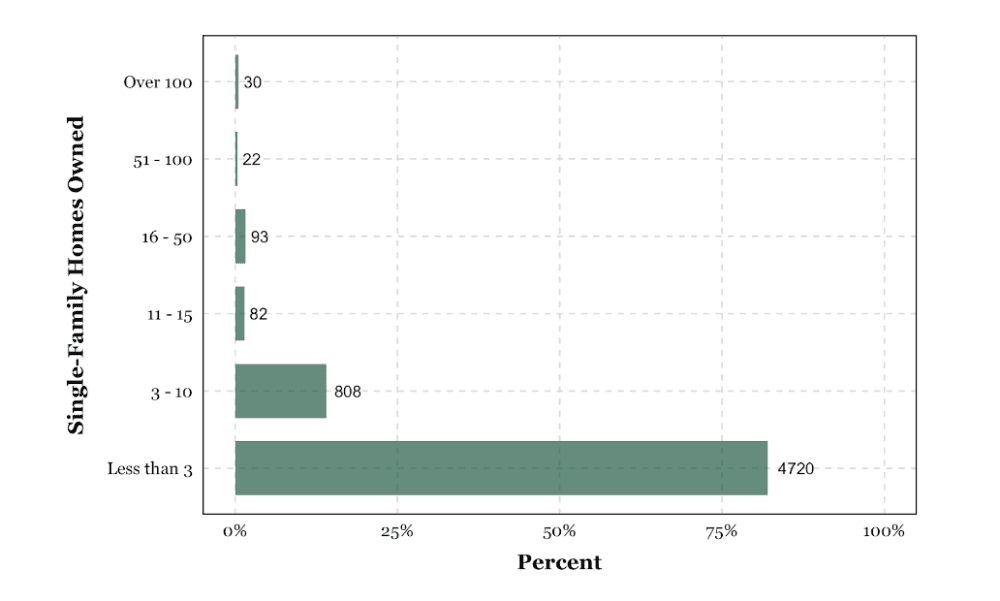
We now focus on separating corporate investors from non-corporate entities by examining the investor column to count the number of times a particular investor owns a single-family home. We then categorize the respective counts into particular ranges before summing the number of corporations within each range. Figure 1 demonstrates that approximately 80% of all corporate-owned single-family properties are held by a corporation with less than three properties in Mecklenburg County. 4,720 out of the 5,755 estimated corporations own either one or two single-family homes in our community, which would not meet the standard of these entities being labeled as corporate landlords.
How should we determine whether an investor is labeled a corporate landlord? While there are differing opinions on this issue, we elect to follow recent studies and label investors as corporate landlords when their names appear 15 or more times, indicating that the entity owns at least 15 properties in Mecklenburg County (Raymond et al., 2016; Goodman et al., 2023). We, therefore, estimate that 145 investors should be considered corporate landlords.
While 145 out of 5,755 investors can be classified as corporate landlords, how many single-family homes do corporate landlords own in Mecklenburg County?
Corporate landlords account for 67% (20,421) of all investor-owned single-family homes.
They also account for approximately 7.6% of all single-family homes (296,455) in Mecklenburg County.
Moving forward
Until recently, “corporate landlords” was a term commonly applied to any corporate owner. We have illustrated that most homeowners designated as a “corporation” own fewer than three single-family homes. Only 145 corporations, however, account for nearly 70% of all corporate-owned homes and just under eight percent of all single-family homes in Mecklenburg County. Differentiating corporate landlords from smaller corporations allows us to more accurately address several questions related to the presence of corporate landlords, including: 1) where are corporate landlords located within Mecklenburg County; 2) what is the value of homes owned by these entities; and 3) is there a relationship between the presence of corporate landlords and the racial/ethnic composition of the neighborhood?
References:
- An, B. Y., Jakabovics, A., Orlando, A. W., Rodnyansky, S., & Son, E. (2024). Who Owns America? A Methodology for Identifying Landlords’ Ownership Scale and the Implications for Targeted Code Enforcement. Journal of the American Planning Association, 1-15.
- Goodman, L., Zinn, A., Reynolds, K., & Noble, E. (2023). A profile of institutional investor–owned single-family rental properties. Urban Institute.
- Mecklenburg County Land Records Management. (2024). Tax parcels with CAMA data, 2023 [Data set]. Mecklenburg County GIS. https://mecklenburgcounty.hosted-by-files.com/OpenMapping/Parcel%20Data%20Archive/
- Raymond, E. L., Duckworth, R., Miller, B., Lucas, M., & Pokharel, S. (2016). Corporate landlords, institutional investors, and displacement: Eviction rates in single-family rentals. FRB Atlanta community and economic development discussion paper, (2016-4).
- Zager, K., Jackson-Gordon, R., McCoy, B. (2023). 2023 North Mecklenburg demographic and housing assessment: Report update. UNC Charlotte Urban Institute.
Applications open for the next Gambrell Faculty Fellows cohort
The UNC Charlotte Urban Institute seeks the sixth cohort of faculty fellows to research issues related to economic mobility in the Charlotte region, with support from The Gambrell Foundation.
This year, the Gambrell Faculty Fellows program will fund up to six projects with grants up to $18,000 each. The fellows will join a growing group of researchers contributing to our community’s ongoing search for solutions that could foster greater upward economic mobility and an improved quality of life for residents in our region.
[Find the full program details here. The application materials can be downloaded as a Microsoft Word document here.]
All UNC Charlotte full-time faculty members with the title of assistant professor or higher whose job description includes professional expectations for research may apply for this fellowship. Other key requirements include:
- The deadline for submissions is 5 p.m. on Friday, October 4.
- The fellowships will fund short-term research projects (up to 18 months).
- The grant period will begin on November 1, 2024.
- Proposed projects must include a principal focus on issues related to economic mobility and/quality of life. Quantitative, qualitative, and mixed-methods projects will be considered.
If you have questions about this process, contact Elaine Jacobs and Lori Thomas at uiresearch@charlotte.edu.
“With a fellowship of 44 strong, we are excited to once again invite our faculty to become a Gambrell Fellow and examine economic mobility in our community, providing actionable information for our community and region,” said Dr. Lori Thomas, executive director of the UNC Charlotte Urban Institute and the Charlotte Regional Data Trust. “We are grateful to The Gambrell Foundation for funding community engaged research.”
Previous cohorts of Gambrell Faculty Fellows include faculty from seven colleges and 22 different academic disciplines. Fellows are studying issues such as the impact of the COVID-19 pandemic on Black women, transit and access to jobs, the relationship between rental housing and educational opportunities, Latinx children’s access to early education and the impact of the arts on economic mobility.
In addition to conducting and publishing research, Gambrell Faculty Fellows also participate in conversations about the role of housing, transportation, racial discrimination and more on economic mobility in Charlotte. These serve as a forum to engage the community and highlight fellows’ work.