Maps
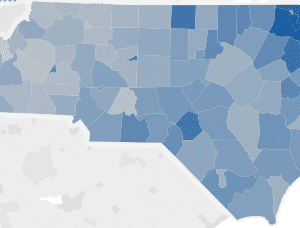
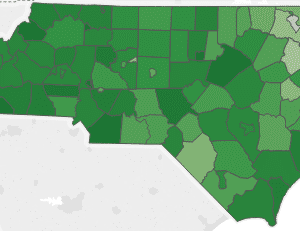
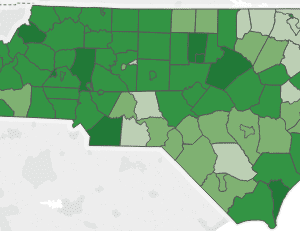
This week’s map illustrates the teacher turnover rate, by school district, for the 2013-14 school year. Teacher turnover is the percentage of teachers who are no longer employed in the district from one year to the next. In 2013-14, 14.1 percent (13,557) of all North Carolina teachers left their school district. In addition to the […]
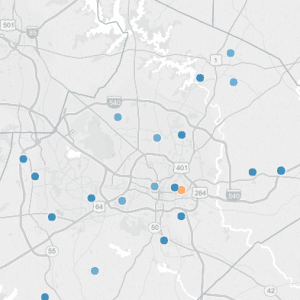
This week’s map takes a closer look at the latest Annual Measurable Objectives (AMOs) at the school level. AMOs are a series of performance targets that state, school districts and schools must meet on designated assessments and indicators for specific subgroups of students annually to meet the requirements of the Elementary and Secondary Education Act […]
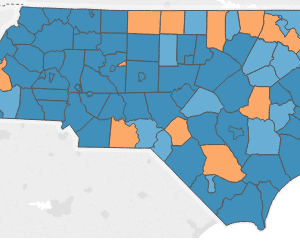
This week’s map looks at the school districts that met annual measurable objectives (AMOs) across the state. AMOs are a series of performance targets that state, school districts and schools must meet on designated assessments and indicators for specific subgroups of students annually to meet the requirements of the Elementary and Secondary Education Act (ESEA) […]
This week’s map takes a closer look at the newest proficiency data at the school level. The table to the right of the map lists proficiency rates in descending order for the subject and grade selected for all schools in the district. You can also view school proficiency rates for specific grades, subjects and student […]
This week’s maps take a closer look at the newest proficiency data by school district. We have separated the data into two dashboards—one for end-of-grade (EOG) proficiency and one for end-of-course (EOC) proficiency. Each shows proficiency rates of subject and, for the EOGs only, the grade. The table below the map lists the percent proficient […]
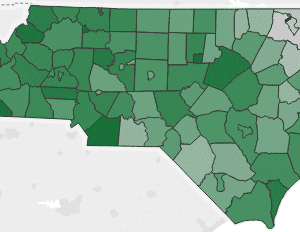
This week’s map looks at the newest proficiency data for school districts for end-of-grade (EOG) and end-of-course (EOC) exams. EOG proficiency rates reflect the share of all end-of-grade tests taken (3rd-8th for reading and math, 5th-8th for science) that were scored proficient. EOC proficiency rates are the percent of all end-of-course tests taken (in Math […]
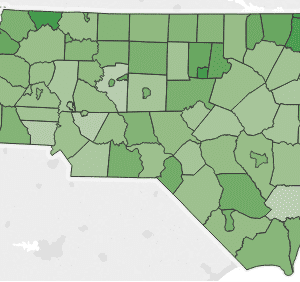
This week’s map takes a closer look at how per-pupil expenditures are spent at the district level. The types of per-pupil expenditures include employee benefits, instructional equipment, purchased services, salaries, and supplies and materials. Hover over the map to view where per-pupil expenditures are spent and the percent of per-pupil expenditures spent in the selected […]
This week’s map looks at per pupil expenditures for each school district by federal, state and local funding sources. Choose from the menu above the map to select a funding source, and use the slide bar to change the school year. Hover over the map to view per pupil expenditures and the percentage of per […]
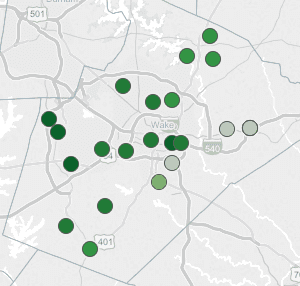
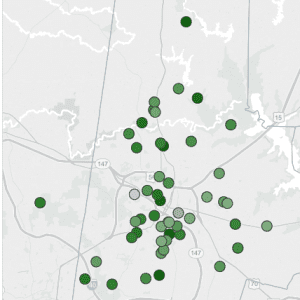
This week’s map looks at SAT scores and participation at the school level, 2013-14. Choose your district and a specific measure from the dropdown menus above the map. All the numbers are also provided in the table to the right for the schools in the district selected, as well as the district, state and national […]
This week’s map looks at SAT scores and participation in 2013-14. The SAT exam measures the critical reading, math and writing abilities of students, providing critical measures of college readiness. Choose a test component or the percentage of students who took the SAT exam from the dropdown menu above the map. All the numbers are […]

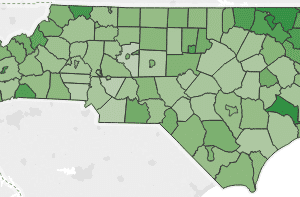
This week’s map shows high school graduation rates at the school level and presents the latest numbers for various demographic groups. Choose a district and demographic group from the menu to the right of the map to see the rates for students of a particular race/ethnicity, sex, socio-economic status, English proficiency, or gifted status. Schools […]
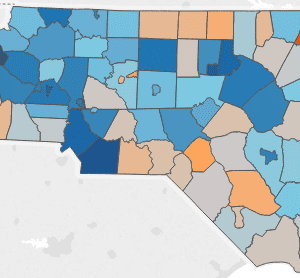
This week’s map continues exploring high school graduation rates across the state and presents the latest numbers for various demographic groups. Choose from the menu below the map to see the rates for students of a particular race/ethnicity, sex, socio-economic status, English ability, or gifted status. Districts in blue are above the state average for […]