Maps
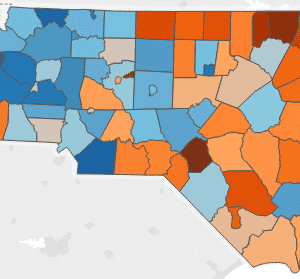
This week’s map looks at the latest high school graduation rates across the state. While statewide, 83.9 percent of students graduated in four years, graduation rates for school districts range from around 70 percent to 95 percent. Districts in blue are above the state average, and those in orange are below. A few observations: Around […]

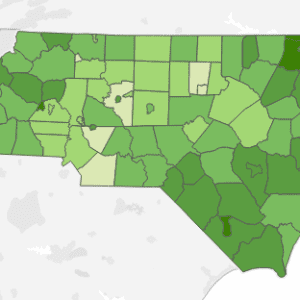
This week’s map looks at the intersection of two previous topics: student demographics and free and reduced lunch applicants. Staff

The UNC Charlotte Urban Institute is providing weekly maps and data dashboards to highlight relevant statewide education statistics for EducationNC, a nonpartisan, nonprofit news source aiming to create a bipartisan, statewide conversation about public schools. Learn more about this new initiative here. This week’s EdMap examines the demographics of students during the 2013-14 school year. […]
The UNC Charlotte Urban Institute is providing weekly maps and data dashboards to highlight relevant statewide education statistics for EducationNC, a nonpartisan, nonprofit news source aiming to create a bipartisan, statewide conversation about public schools. Learn more about this new initiative here. This week’s EdMap allows you to explore the prevalence of Title I schools […]

The UNC Charlotte Urban Institute is providing weekly maps and data dashboards to highlight relevant statewide education statistics for EducationNC, a nonpartisan, nonprofit news source aiming to create a bipartisan, statewide conversation about public schools. Learn more about this new initiative here. This week’s EdMap allows you to explore differences in free and reduced lunch […]

The UNC Charlotte Urban Institute is providing weekly maps and data dashboards to highlight relevant statewide education statistics for EducationNC, a nonpartisan, nonprofit news source aiming to create a bipartisan, statewide conversation about public schools. Learn more about this new initiative here. This week’s EdMap allows you to explore the data showing applications for free […]

The UNC Charlotte Urban Institute is providing weekly maps and data dashboards to highlight relevant statewide education statistics for EducationNC, a nonpartisan, nonprofit news source aiming to create a bipartisan, statewide conversation about public schools. Learn more about this new initiative here. This week’s EdMap allows you to explore rates of proficiency among students with […]
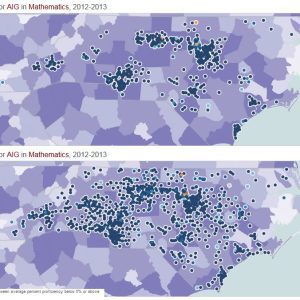
The UNC Charlotte Urban Institute is providing weekly maps and data dashboards to highlight relevant statewide education statistics for EducationNC, a nonpartisan, nonprofit news source aiming to create a bipartisan, statewide conversation about public schools. Learn more about this new initiative here. This week’s education map lets you examine student proficiency and academically gifted students […]

The UNC Charlotte Urban Institute is providing weekly maps and data dashboards to highlight relevant statewide education statistics for EducationNC, a nonpartisan, nonprofit news source aiming to create a bipartisan, statewide conversation about public schools. Learn more about this new initiative here. This week’s statewide education map lets you examine N.C. student proficiency statewide, or […]
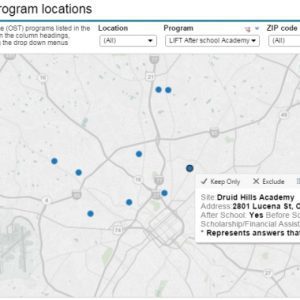
The Council for Children’s Rights has partnered with the UNC Charlotte Urban Institute to create a locator map of “out-of-school-time” programs in Mecklenburg County. The interactive map allows users to identify programs based on a specific neighborhood location by zooming in on the map. Users can also select programs by location, program name, zip code […]
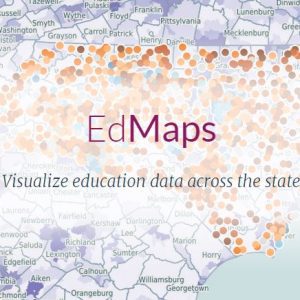
EducationNC – a nonpartisan, nonprofit news source aiming to create a bipartisan, statewide conversation about public schools – launched Jan. 12. EdNC.org will provide online data, research, news, information and analysis about major trends, issues and challenges facing N.C. schools. On Mondays, Zach Szczepaniak and Claire Apaliski of the UNC Charlotte Urban Institute – building […]
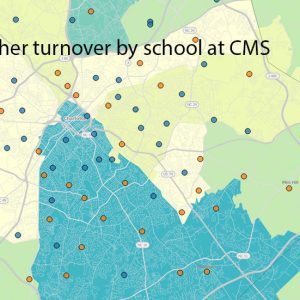
Increasing teacher turnover has been in the news for districts across North Carolina. The Charlotte-Mecklenburg Schools district is no exception – but what does teacher turnover look like when you get down to the individual school? Interactive maps and dashboards give you a new perspective. The UNC Charlotte Urban Institute has partnered with MeckEd through […]